
Color and the Dealer-Gamma Constraint
Opening Conditioning, Intraday Propagation, and Regime-Dependent Range Dynamics in Index Options
OpenGamma Research, version 1.0, June 10, 2026. Exploratory and not peer-reviewed; not investment advice or a trading signal.
Abstract
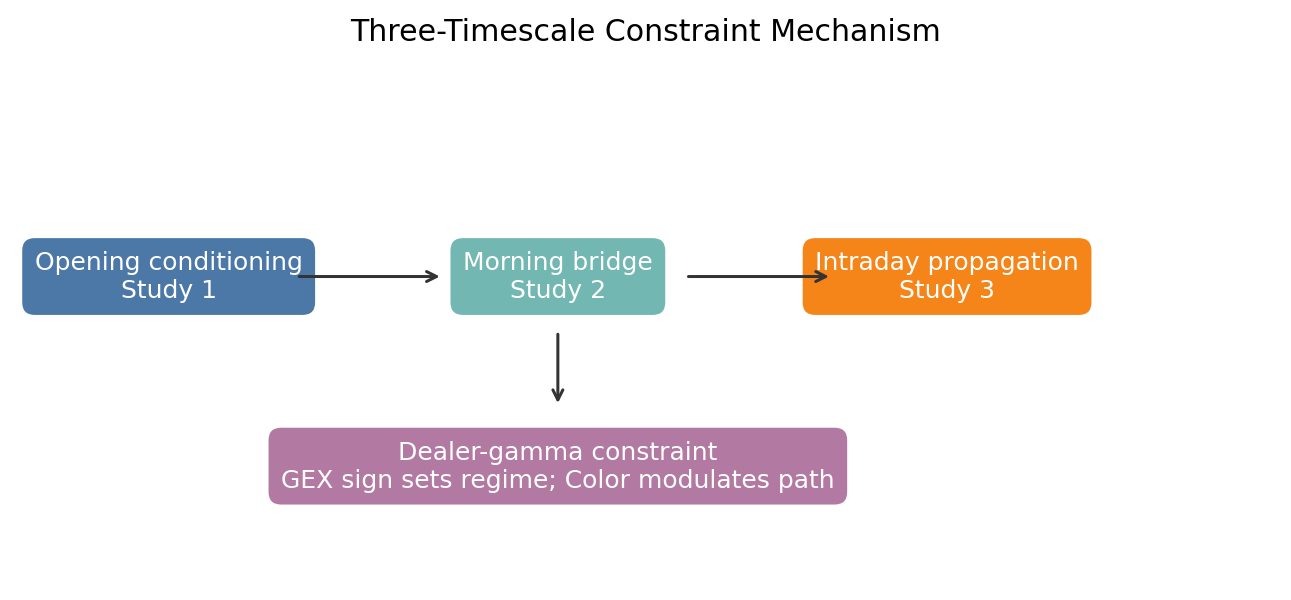
We study a single mechanism — the dealer-gamma constraint imposed by the third-order Greek Color (the rate of change of gamma with time) — at two horizons in index options. Part I asks whether the opening-minute Color surface is associated with same-session realized day type across native-index (RUTW→ES/RTY, SPXW→ES) and ETF-proxy (QQQ→NQ) rails. Part II asks whether intraday de-seasonalized changes in Color and net GEX carry lead-lag information for subsequent M15 realized range, estimated as a session-fixed-effects panel VAR with a positive-vs-negative-GEX regime split on SPX, RUT, QQQ, and IWM.
Part I headline. High opening-minute net Color intensity is associated with materially suppressed same-session large expansion. The effect is the study's primary result on SPXW (Color-LOW 29.47% → HIGH 10.67% large-expansion rate; pooled LOW−HIGH gap +18.79pp, Cohen's h 0.482, permutation p<0.0001, monotone descending at all four opening minutes), the largest effect in the study on QQQ (LOW 32.02% → HIGH 8.23%; gap +23.79pp, h 0.621, p<0.0001), and the correct sign though underpowered on RUTW (gap +7.87pp, p=0.0975). On SPXW the same intensity gradient produces a complementary compression tilt (TRUE_BALANCE LOW 16.57% → HIGH 27.67%; gap −11.09pp, h −0.269, p=0.025). The signed-Color cohort is the most consistent single pattern in the study: NEGATIVE-Color sessions realize far more large expansion on every rail (SPXW 32.08% vs 12.11%; QQQ 28.69% vs 10.16%; RUTW 23.39% vs 16.32%) — a genuine contrast with the VEX benchmark, where sign was a null. RUTW TRUE_BALANCE is a clean null and is reported as such. Crucially, when we add a prior-only prior-day realized-range control (constructed from the M15 candles), the Color coefficient loses significance on every rail (sign preserved; QQQ marginal at GEE p≈0.10) while prior-day range becomes the dominant covariate — so the strong unconditional gradient is, in material part, a volatility-clustering proxy, and Color survives the control less well than net-VEX did in the benchmark study. Color's defensible role is as a regime modulator and intraday lead variable, not a stand-alone controlled predictor of day type.
Part II headline. After bar-of-day de-seasonalization (residual at machine precision, 1e-17), regime conditioning is essential: pooling across GEX regimes destroys the range signal on the native rails. Split by opening-bar GEX sign, GEX→Range Granger-predicts next-bar range in positive-GEX sessions on both native rails (SPX p<0.05; RUT p<0.10), and the point IRF traces a compression-then-release pattern (bar-1 negative, ~bar-4 rebound on SPX). GEX↔Color coupling is universal (p<0.05 both directions in every root and regime). Color→Range is absent on the native index but present on both ETF-proxy rails (QQQ, IWM p<0.05), consistent with Color reaching native-index range only through the two-step Color→GEX→Range path. A Range→Color feedback appears in SPX positive-GEX sessions (p<0.05). The bootstrapped 90% IRF bands (500 session-cluster iterations) include zero at most individual horizons, and a forecast-error variance decomposition shows surface shocks explain under ~1.2% of next-bar range variance everywhere (largest where the Granger test is significant — SPX POS_GEX 0.38%, QQQ ~1.1%): the Granger lead-lag is statistically supported and regime-consistent; the bar-by-bar IRF timing is not established, and the economic magnitude is small — the surface tilts the conditional range distribution, it does not drive range.
The unifying claim is not a standalone Color signal — it is a regime map. GEX sign sets the volatility backdrop; Color describes how fast the surface is reconfiguring inside that backdrop; together they describe whether the dealer-gamma constraint suppresses, defers, or propagates realized range. Color is a range/expansion channel, not a direction classifier, and not an entry trigger.
Keywords: index options, Color, third-order Greeks, dealer hedging, gamma exposure, intraday range, panel VAR, impulse response, day-type taxonomy.
1. Research Program and Hypotheses
The first- and second-order dealer-hedging channels (delta, gamma) have been well characterized since Garleanu, Pedersen, and Poteshman (2009), and gamma-pinning at expiration is documented by Ni, Pearson, and Poteshman (2005). Higher-order cross-derivatives are typically assumed to cancel in aggregate or to be dominated by gamma on intraday horizons — the implicit argument being that the theta-driven adjustment to the gamma-delta hedge, the channel through which Color operates, is too slow to matter within a session. This program challenges that assumption empirically across three horizons:
Part I and Part II are merged here because they are two resolutions of the same surface-constraint question — one static at the open, one dynamic inside the session — and the bridge that connects them is the program's actual thesis: the dealer-gamma constraint does not eliminate range; conditional on GEX sign it suppresses, defers, or amplifies it.
Pre-registered hypotheses and verdicts
| Hyp | Claim | Verdict | Where |
|---|---|---|---|
| C1 | Color intensity → TRUE_BALANCE / LARGE_EXPANSION | SUPPORTED unconditionally (SPXW headline, QQQ strongest, RUTW directional; compression leg SPXW-only) but NOT robust to a prior-day-range control (§3.7b) — Color loses significance once volatility clustering is held fixed | §3.2–3.4, §3.7 |
| C2 | Color × Charm / Gamma / GEX composite adds over single factors | PARTIAL — GEX sign joined and stratified (§3.6); net-GEX-denominator C/G refused (unstable at the flip); gross-gamma denominator unavailable in the joined matrix | §3.6 |
| C3 | Color classifies range/balance, not direction | SUPPORTED — DIRECTIONAL_CLOSE rises with Color-HIGH on all rails | §3.5 |
| C4 | Color beats unconditional / prior-day / opex baselines | FAILS the prior-day-range baseline — Color's day-type signal is not significant net of prior-day realized range (§3.7b) | §3.7 |
| C5 | Native-index and ETF-proxy rails never pooled | RESPECTED throughout | both parts |
| C6 | Signed Color reported as a distinct cohort | SUPPORTED and notable — NEGATIVE Color → more expansion on every rail | §3.4 |
| P1 | Intraday ΔGEX/ΔColor lead Δrange (Granger), regime-split | SUPPORTED with regime conditioning (native GEX→Range in POS_GEX); IRF timing not established (wide bands) | §4 |
2. Data and Guardrails
PART I — Opening Color and Same-Session Day Type
3. Part I Results
3.1 The headline gradient, all rails
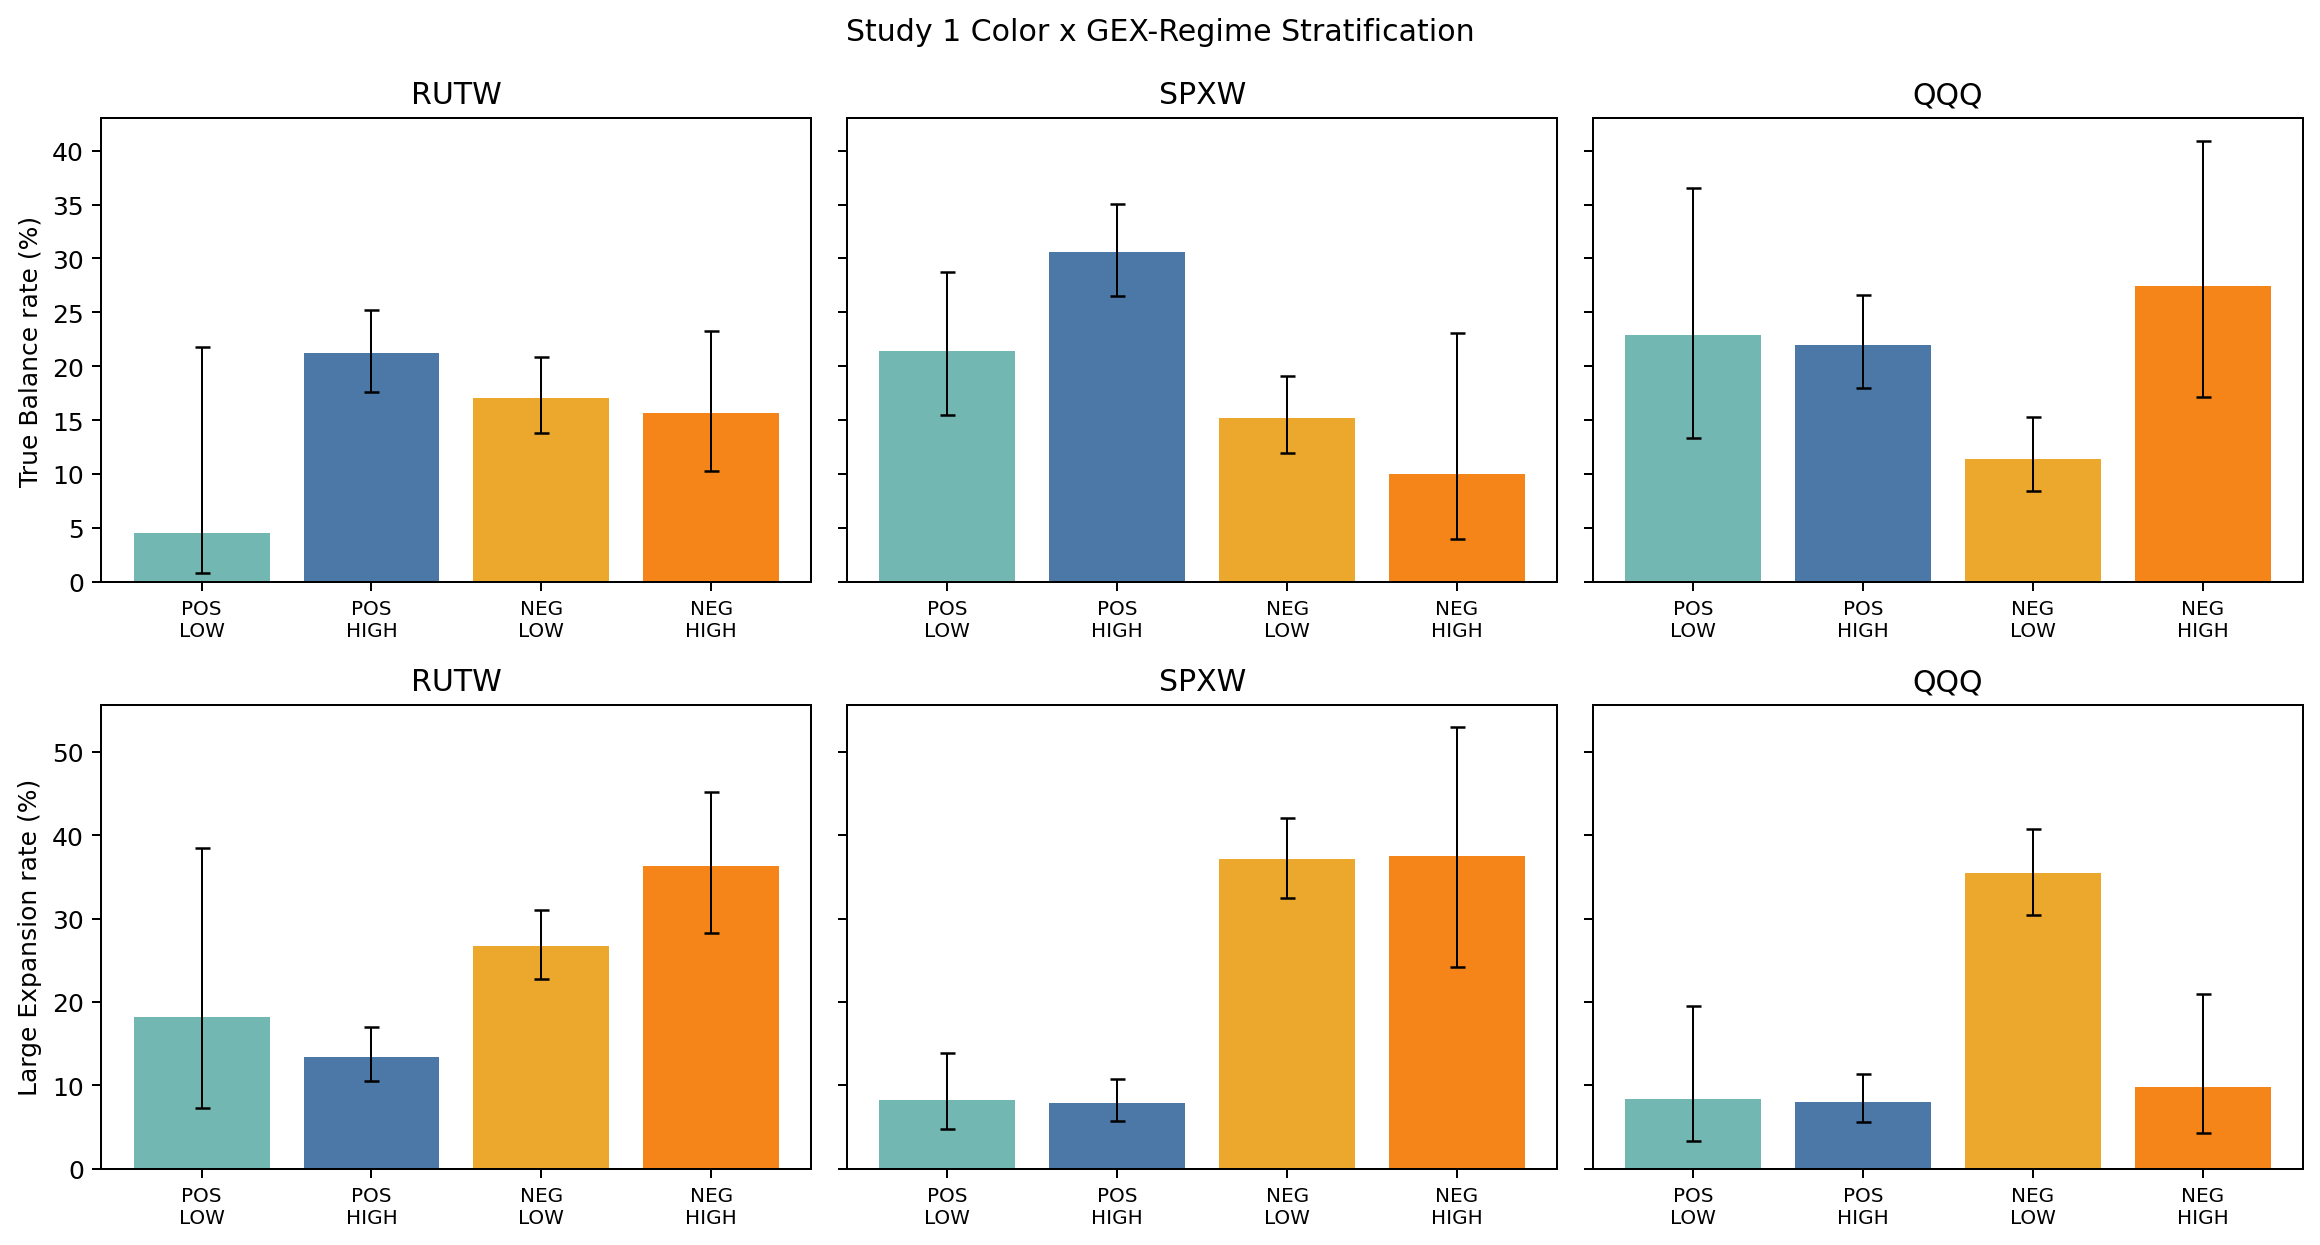
Figure 1 summarizes the pooled LOW-vs-HIGH gradients with Wilson 95% intervals on the corrected per-bucket n. The expansion-suppression leg (right) is the headline; the compression leg (left) is SPXW-only.
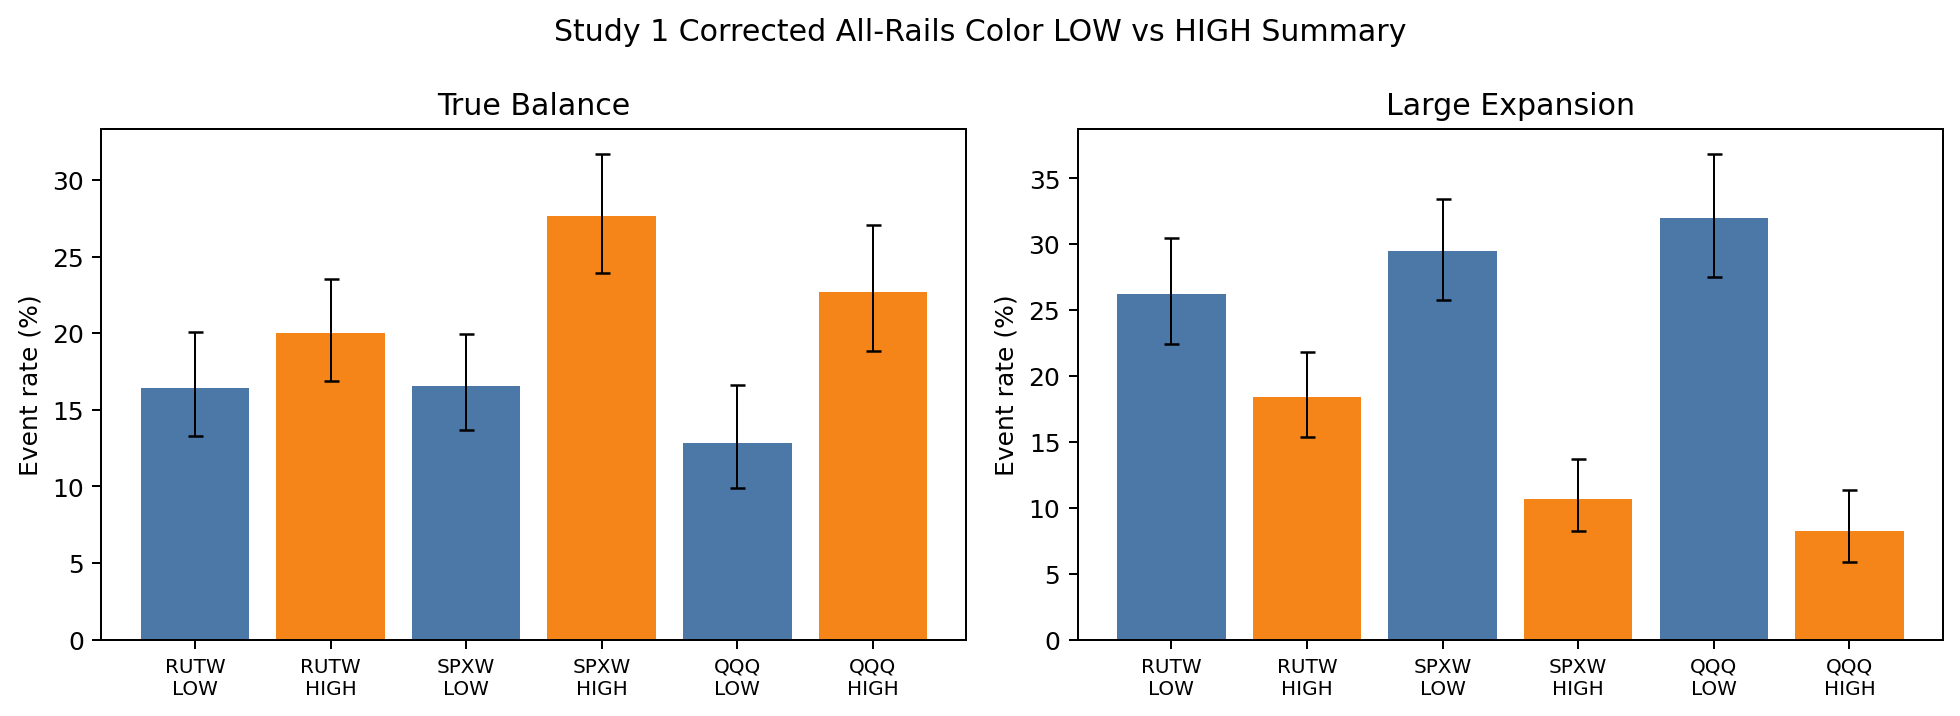
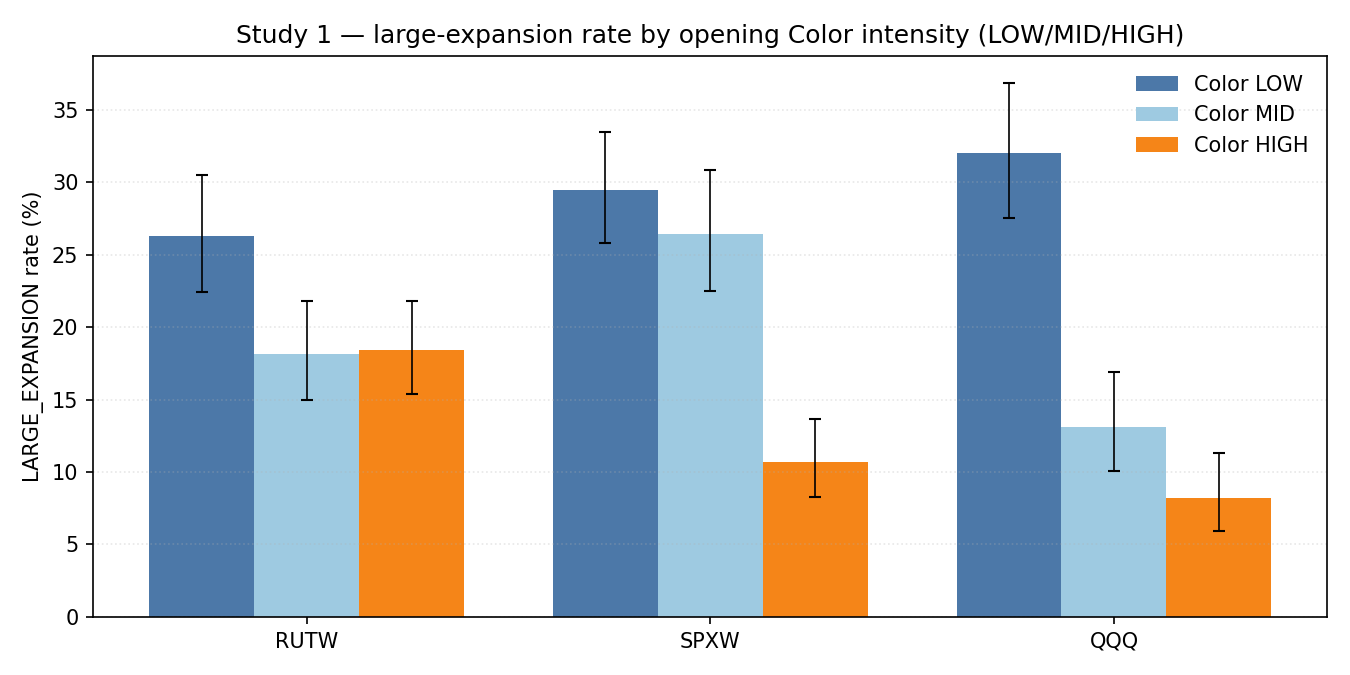
A clearer three-bucket view of the monotonic suppression gradient (LOW→MID→HIGH, not just the endpoints) is given in Figure 1b, and the signed-Color result in Figure 2 (§3.4).
3.2 SPXW — the headline rail
LARGE_EXPANSION (prior-60), pooled across 09:31–09:34:
| Bucket | n | Events | Rate | 95% CI |
|---|---|---|---|---|
| LOW | 543 | 160 | 29.47% | [25.8%, 33.4%] |
| MID | 431 | 114 | 26.45% | [22.5%, 30.8%] |
| HIGH | 506 | 54 | 10.67% | [8.3%, 13.7%] |
Reconciliation: 160+114+54 = 328 expansion rows; 543+431+506 = 1,480 → 22.16% base. ✓ LOW−HIGH gap +18.79pp; bootstrap 95% CI [9.5, 28.3]; Cohen's h 0.482; permutation p<0.0001; monotone descending at all four windows. Verdict: HEADLINE RESULT.
TRUE_BALANCE (prior-60), pooled:
| Bucket | n | Events | Rate | 95% CI |
|---|---|---|---|---|
| LOW | 543 | 90 | 16.57% | [13.7%, 19.9%] |
| MID | 431 | 78 | 18.10% | [14.7%, 22.0%] |
| HIGH | 506 | 140 | 27.67% | [23.9%, 31.7%] |
LOW−HIGH gap −11.09pp; bootstrap 95% CI [−20.9, −0.4]; h −0.269; permutation p=0.025; monotone ascending at all four windows. Verdict: SUPPORTED (compression leg). On SPXW the two endpoints move in opposite directions under the same intensity gradient — exactly the signature of a single suppress-the-range mechanism.
3.3 QQQ — the largest effect (ETF proxy)
LARGE_EXPANSION, pooled: LOW 32.02% (n=381) → MID 13.10% (n=374) → HIGH 8.23% (n=401). Gap +23.79pp; bootstrap [13.1, 34.7]; h 0.621 (largest in the study); p<0.0001; monotone descending at all windows. Verdict: STRONG (ETF-proxy). Corroborates the SPXW suppression on a different underlying — strengthening external validity even though the ETF hedging channel may differ. TRUE_BALANCE: non-clean — LOW 12.86% is the distinctly low cell with MID≈HIGH (22.5%/22.7%); read as a low-Color→low-balance effect, not balance promotion (gap −9.83pp, p=0.073).
3.4 RUTW and the signed-Color result
RUTW LARGE_EXPANSION: LOW 26.26% → MID 18.13% → HIGH 18.39%; gap +7.87pp, bootstrap [−2.2, 17.2], h 0.190, p=0.0975, pooled non-monotone. Verdict: DIRECTIONALLY CONSISTENT, UNDERPOWERED — right sign, interval crosses zero. RUTW TRUE_BALANCE: non-monotone at every window, gap −3.59pp, p=0.422. Verdict: NULL — reported as such. Reporting the RUTW null is deliberate and helps bound the cross-rail claim.
The signed-Color cohort (C6) is the most consistent single pattern in the study. Color sign is the direction of the chain Color integral, kept separate from magnitude. The NEGATIVE-Color cohort realizes more LARGE_EXPANSION on every rail:
| Rail | NEGATIVE Color expansion rate | POSITIVE Color expansion rate |
|---|---|---|
| SPXW | 32.08% (n=745) | 12.11% (n=735) |
| QQQ | 28.69% (n=467) | 10.16% (n=689) |
| RUTW | 23.39% (n=932) | 16.32% (n=576) |

Negative aggregate Color — dealer gamma decaying in the destabilizing direction — marks the opposite of a pin: the hedging cascade amplifies rather than damps range. Sign therefore carries information beyond magnitude on these rails. (On TRUE_BALANCE the sign reverses as expected: POSITIVE Color → more balance, e.g. SPXW 27.48% vs 14.23%.)
3.5 Direction diagnostic (C3): a range channel, not a direction classifier
DIRECTIONAL_CLOSE rate rises with Color-HIGH on all three rails — RUTW 19.9%→34.5%, SPXW 22.8%→38.1%, QQQ 17.3%→41.6%. High Color suppresses large range while still permitting (slightly favoring) directional closes inside a contained range. The honest C3 statement: Color is a range/expansion channel, not a direction classifier.
3.6 Robustness additions: GEX join, time-split, Color×GEX stratification
The Study 1 matrix carries no GEX field. Joining opening net-GEX from the overlapping Study 2 payload (coverage: RUTW 376/377 sessions, SPXW 360/370, QQQ 289/289) lets us stratify the Color result by GEX sign and partially address C2.
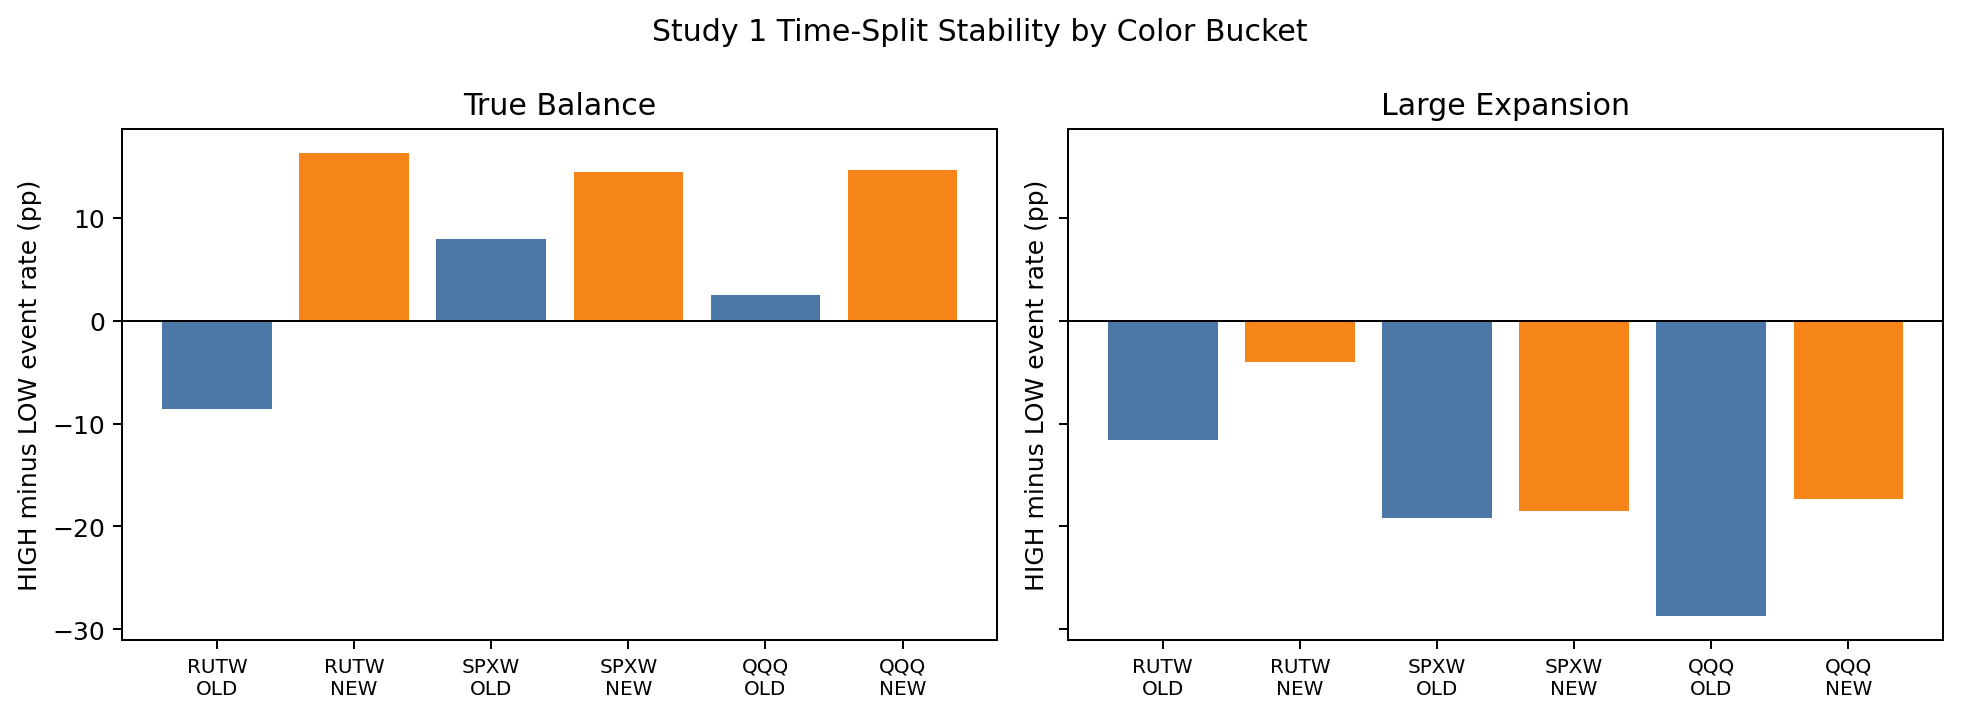
Time-split stability. Splitting each rail at its sample median date, the LARGE_EXPANSION suppression (HIGH−LOW gradient negative) is direction-stable in both halves on all three rails (SPXW −0.184/−0.192 OLD/NEW; QQQ −0.287/−0.173; RUTW −0.116/−0.040). The TRUE_BALANCE lift is stable on SPXW and QQQ but flips sign on RUTW-OLD (−0.086) vs RUTW-NEW (+0.164) — consistent with the RUTW balance null. The expansion leg is robust; the balance leg is rail- and sample-dependent.
Color × GEX-sign stratification. This is the single most informative robustness figure. On SPXW the expansion suppression is concentrated in positive-GEX sessions (POS-HIGH 7.9% vs POS-LOW 8.3% is flat at the floor, while NEG sessions run ~37% regardless of Color); i.e. the suppression operates by holding positive-GEX days down, and negative-GEX days expand whatever Color does. On RUTW and QQQ the negative-GEX/high-Color cell is the expansion-rich one. This is the empirical content behind limitation §5.2.0: part of the raw Color→suppression headline is conditional on — and partly proxies — GEX sign.
C/G ratio still refused. The net-GEX-denominator Charm/Gamma ratio remains refused (it explodes at the gamma flip where net GEX crosses zero); the gross dealer-weighted gamma denominator that would be stable is absent from the joined matrix. C2 is therefore partial: GEX sign is delivered as a stratifier. Charm/Gamma ratio is earmarked for future studies.
3.7 Logistic diagnostics
Two logistic specifications, both diagnostic (omitted controls: VIX regime, scheduled-event flags, total OI, richer opex/DTE — so not causal):
(a) Color-only / GEE, on the original matrix — this is the specification that fits. Standardized Color-intensity percentile and Color-sign indicators, GEE grouped by session. The strong cells are confirmed: QQQ LARGE_EXPANSION GEE coef −0.746, p=0.0001; SPXW LARGE_EXPANSION the unclustered logit is singular (quasi-separation — the Color-HIGH/suppressed-expansion cell is the cleanest in the study; reported, not hidden), so we cite only the GEE: coef −0.4965, p=0.0001. SPXW/QQQ TRUE_BALANCE GEE coefficients are positive and significant (+0.33 p=0.013; +0.28 p=0.048). RUTW cells are not significant, consistent with the underpowered/null verdicts.
(b) GEX-joined partial logit with a prior-day realized-range control materially tempers the headline. The joined matrix uses populated ATM IV and a genuine prior-only prior-day realized-range control constructed directly from M15 futures candles (each session's prior session's RTH range %, strictly lagged). Rows lacking required controls are excluded rather than imputed. The specification regresses each endpoint on standardized Color intensity, prior-day range, GEX magnitude, ATM IV, plus GEX-regime, DTE-bucket, day-of-week and Color-sign indicators; SPXW's unclustered logit is singular (quasi-separation), so SPXW is read from the session-grouped GEE. Result on LARGE_EXPANSION (n = 1,504 / 1,440 / 1,156):
| Rail | Color coef (controlled) | Color p | Prior-day-range coef | Prior-range p |
|---|---|---|---|---|
| RUTW | +0.090 (GEE +0.200) | 0.50 (GEE 0.31) | +0.507 (GEE +0.598) | <0.0001 (GEE 0.003) |
| SPXW (GEE) | −0.155 | 0.43 | +0.780 | 0.003 |
| QQQ | −0.270 (GEE −0.382) | 0.18 (GEE 0.10) | +0.287 (GEE +0.432) | 0.004 |
The honest reading: once prior-day realized range enters, the standardized Color coefficient is no longer statistically significant on any rail — it keeps the suppression sign on SPXW/QQQ and is marginal on QQQ (GEE p≈0.10), but it does not clear conventional significance — while prior-day realized range is a large, highly significant covariate on every rail (the volatility-clustering channel). GEX magnitude is also significant on RUTW (+0.237, p=0.0005). This is the same pattern the VEX benchmark found (prior-day range dominant), with one sharp contrast worth stating plainly: in the VEX study, net-VEX intensity survived the prior-day-range control (β≈+0.29, GEE p=0.013); here Color does not survive as a significant independent predictor of day type once prior-day range is held fixed. The strong unconditional cross-tab gradient (§3.2–3.3, h up to 0.62) is real, but a substantial part of it is plausibly a prior-day-range / volatility-clustering proxy. Color's day-type signal is therefore weaker-than-VEX under control; its more defensible role is as the regime modulator (§3.6) and the intraday lead variable (Part II), not as a stand-alone controlled predictor of the session outcome.
PART II — Intraday Propagation (Panel VAR)
4. Part II Results
Part II asks whether de-seasonalized M15 changes in GEX and Color carry incremental lead-lag information for next-bar range beyond range's own autocorrelation, and how that propagates. This is predictive lead-lag, not identified causality.
4.1 Specification
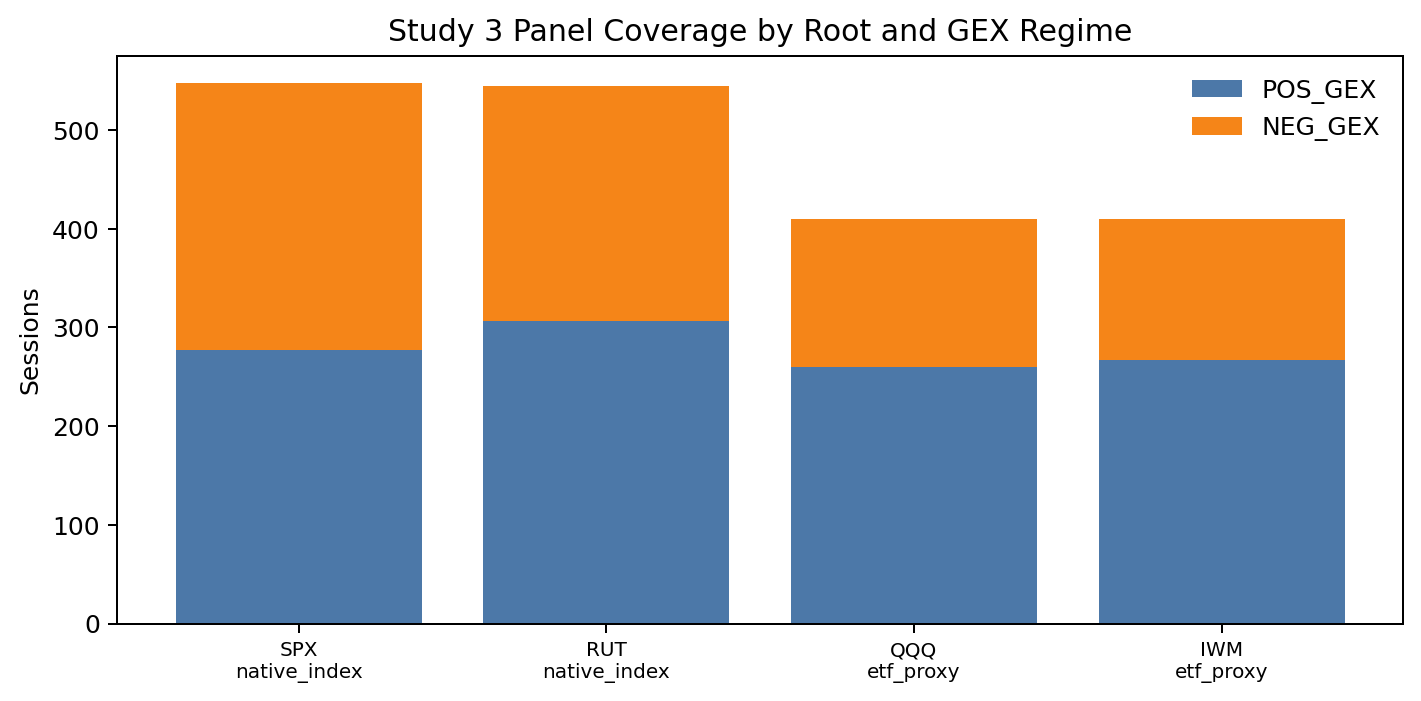
A 3-variable panel VAR in {Δlog_range, Δnet_color_raw, Δnet_gex}, estimated on M15 bars (bar_index 0–25, 09:30–16:00 ET) across SPX (548 sessions, 13,767 bars), RUT (545, 13,565), QQQ (410, 10,196), IWM (410, 10,195).
4.2 Stationarity
ADF + KPSS on each de-seasonalized differenced series: 5 of 12 series are unambiguously STATIONARY; the remaining 7 are AMBIGUOUS (ADF rejects the unit root and KPSS rejects stationarity) — concentrated on the SPX series. The de-seasonalization residual is clean (1e-17); the ambiguity is residual persistence in the differenced surface dynamics themselves. SPX results therefore carry an extra caveat: the VAR may operate on a near-integrated process. No series is unambiguously non-stationary.
4.3 The Granger evidence
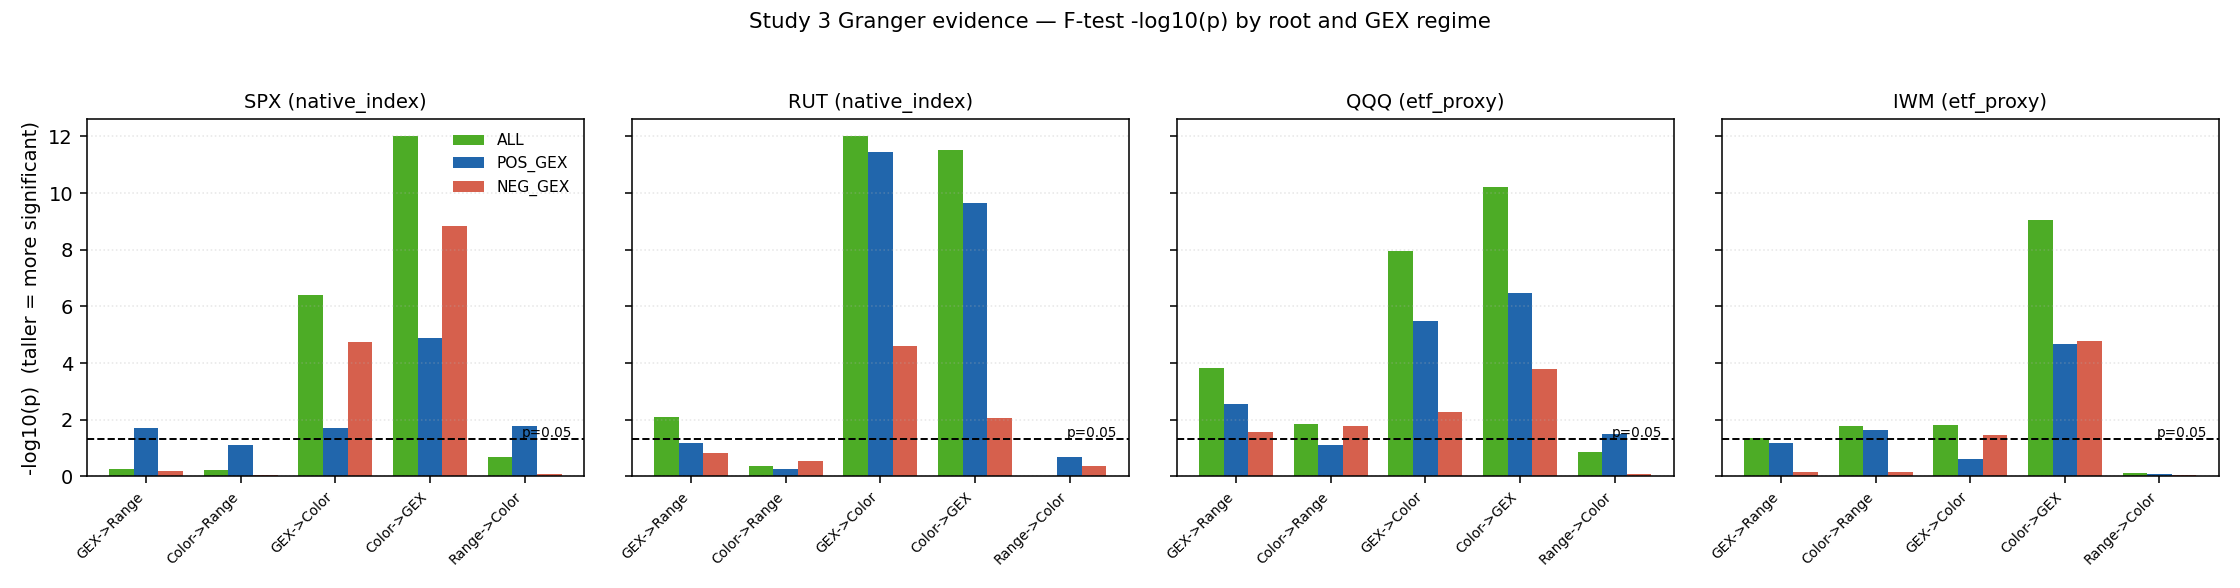
Five structural findings:
4.4 The orthogonalized IRF system
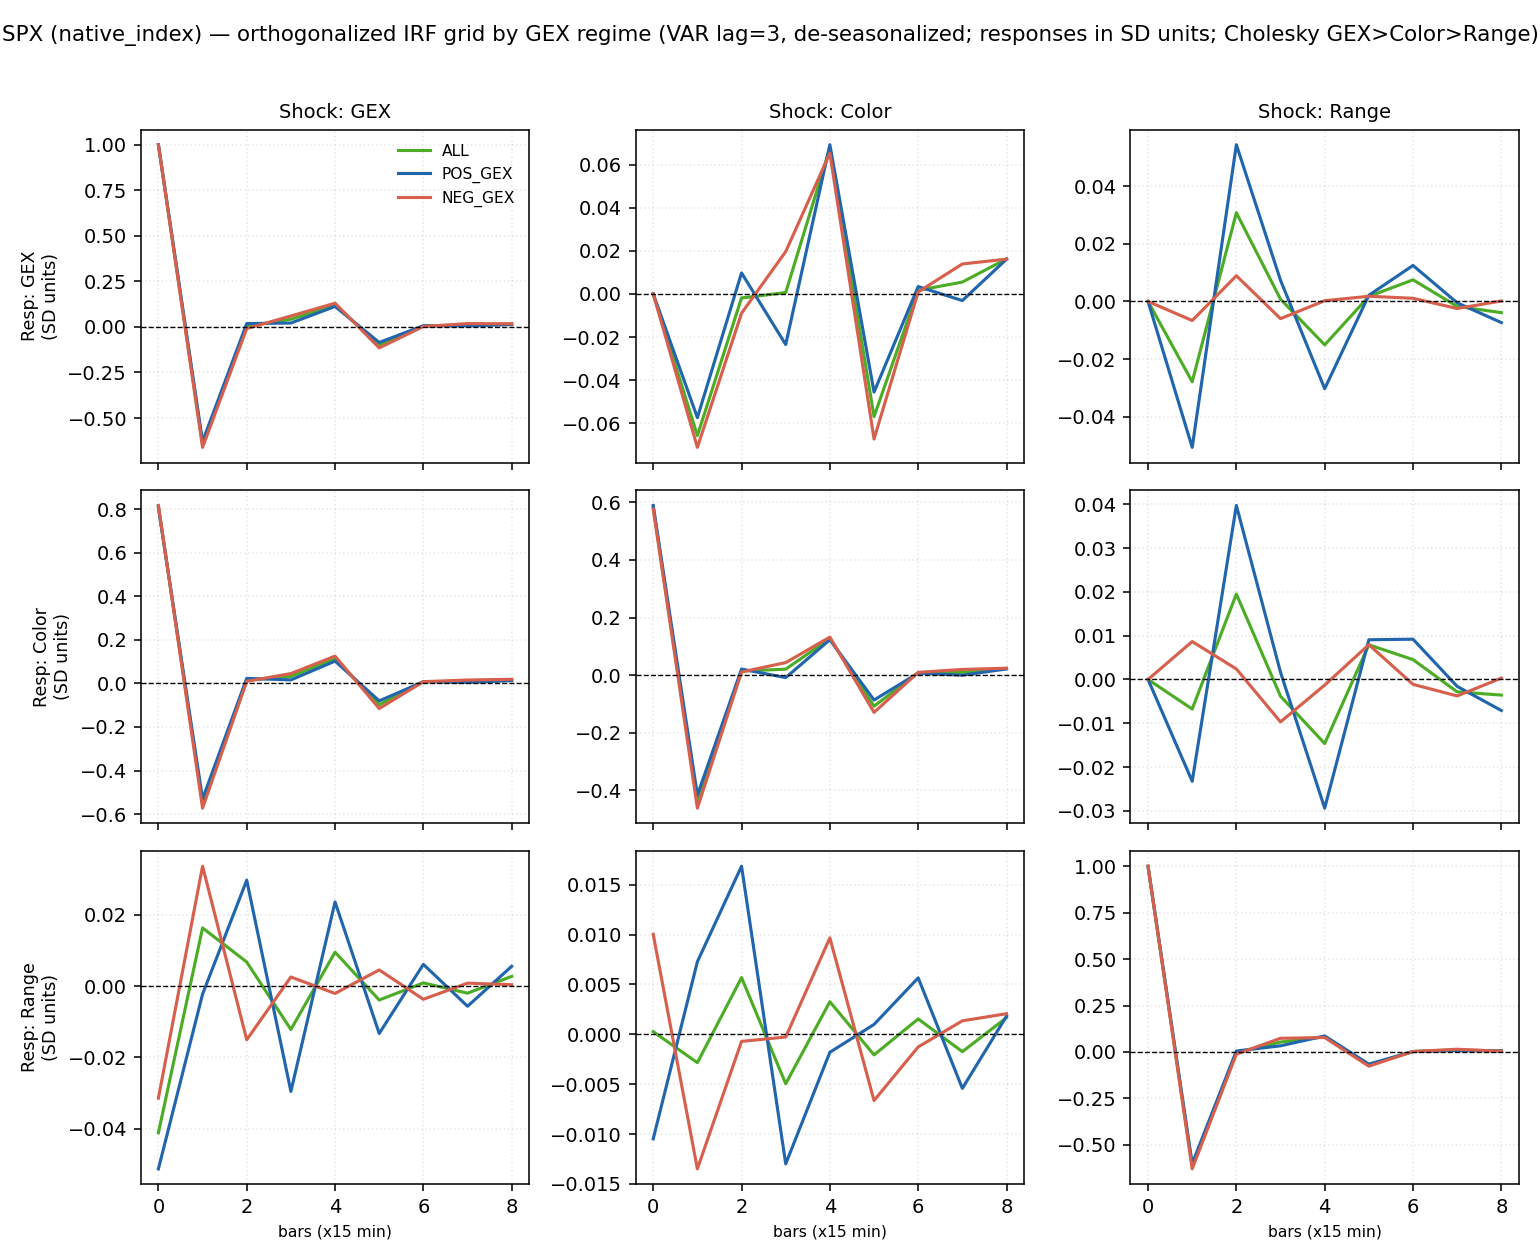
The full system view confirms the Granger map: the GEX↔Color off-diagonal responses are large, oscillatory, and persistent across 8 bars in all regimes (the coupling), while the range-response row (bottom) is an order of magnitude smaller and clearly differs between POS_GEX and NEG_GEX. The range-shock column (right) shows the Range→Color feedback concentrated in SPX POS_GEX.
4.5 GEX→Range impulse response and the timing caveat
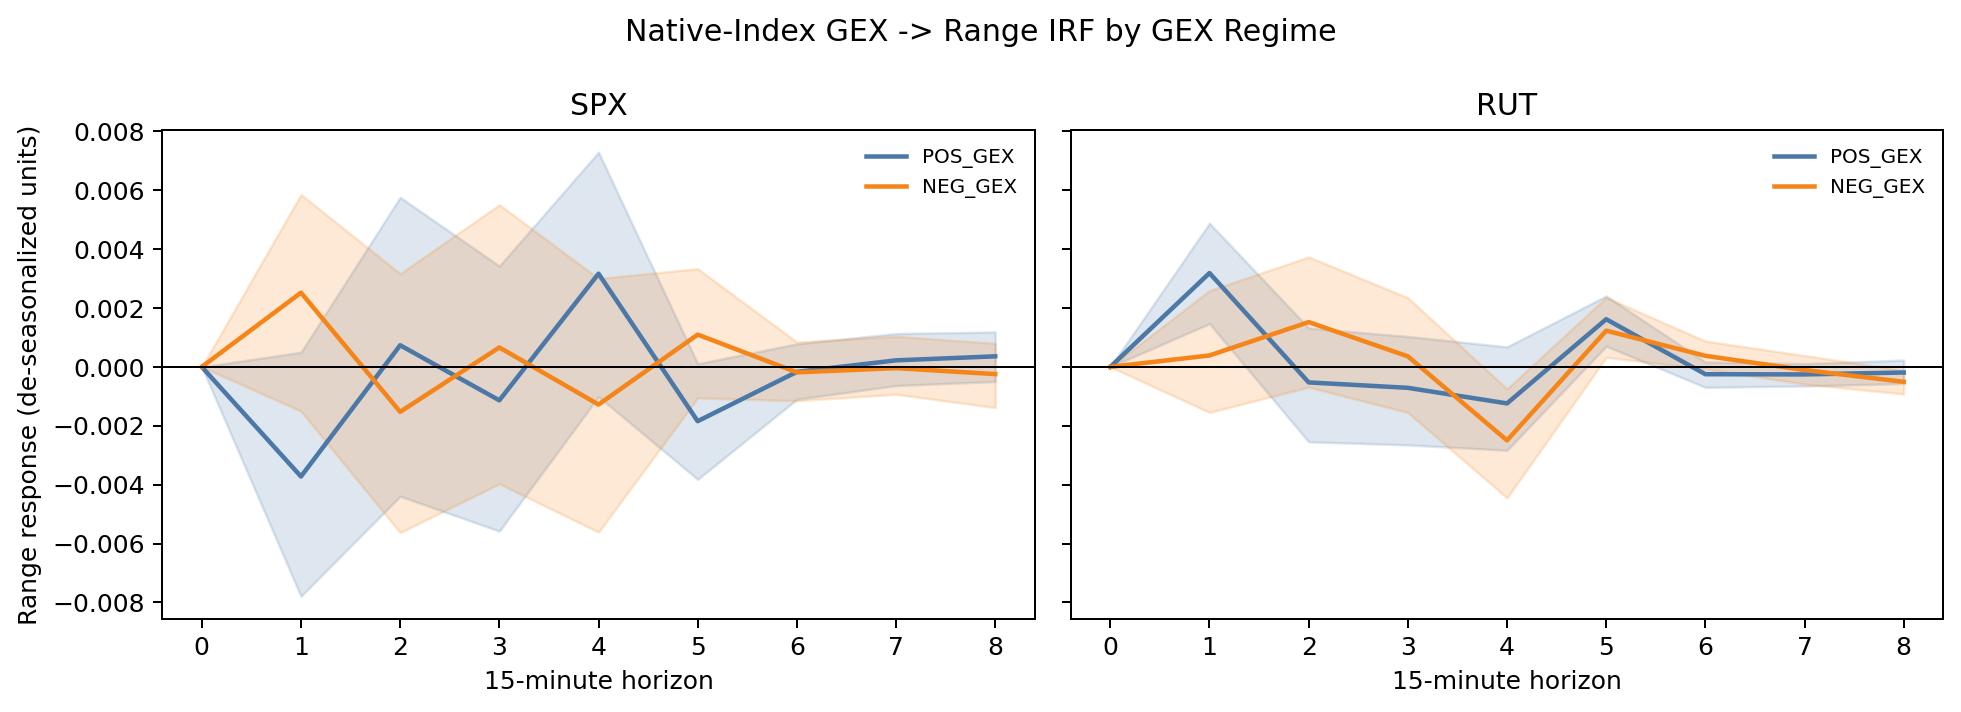
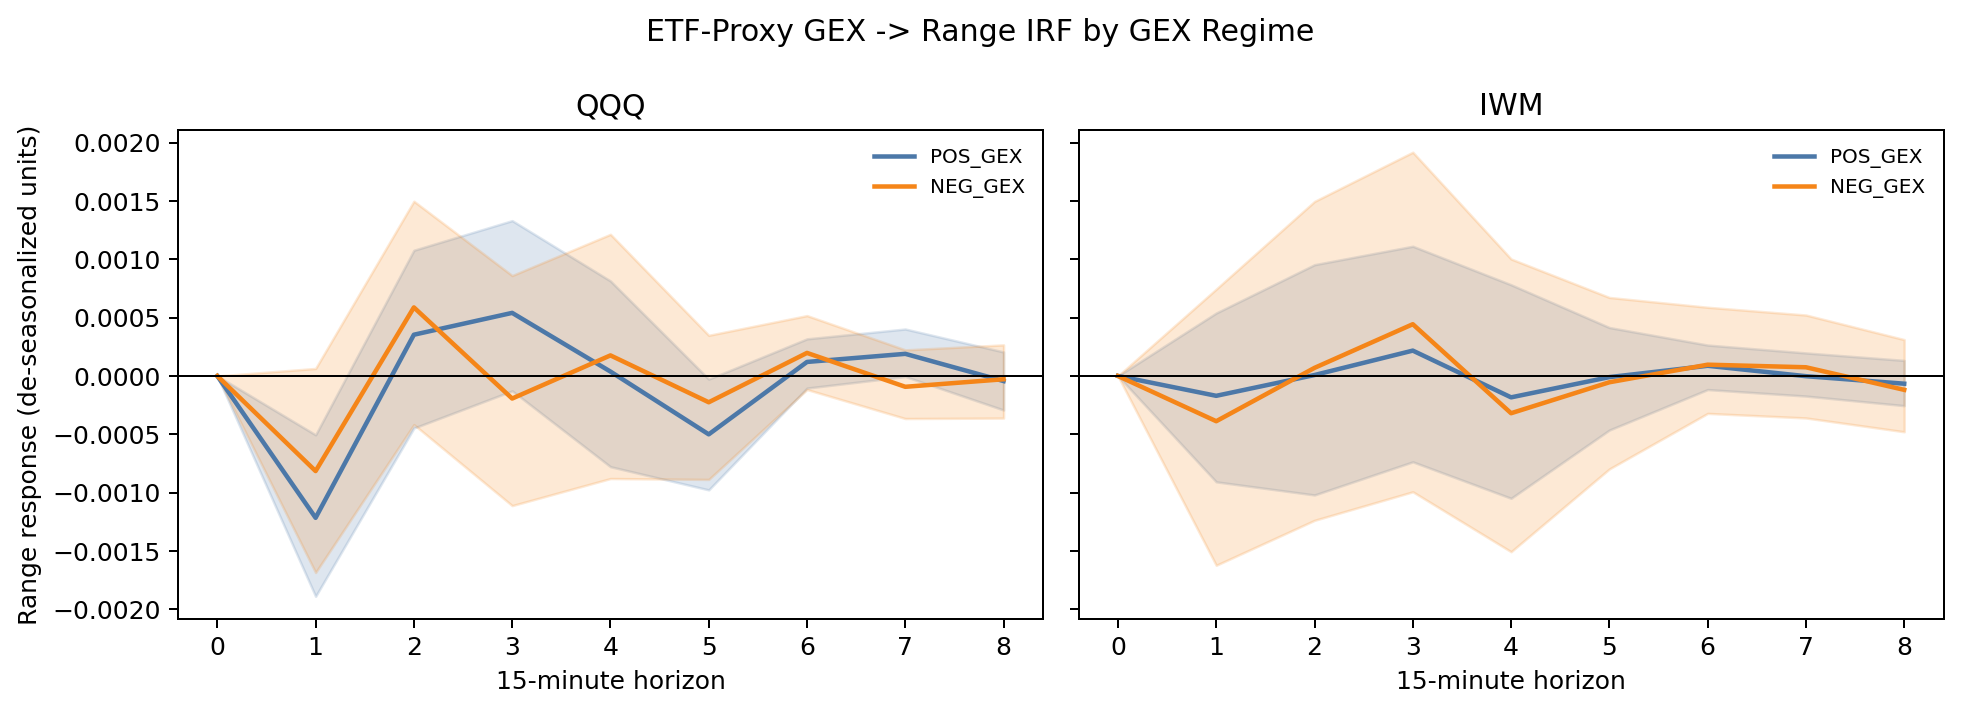
On SPX POS_GEX the point IRF is a compression-then-release: a positive GEX shock is followed by next-bar range compression (peak ~0.0037 in raw de-seasonalized log-range units) that reverses to expansion ~45–60 min later (~bar 4) — the pin-tightening-then-release mechanism in real time. In NEG_GEX the bar-1 response flips positive (~+0.0025): a GEX shock in a short-gamma book generates amplifying hedging flow. The pooled IRF averages these opposite signs to near-noise. But the 90% bootstrap bands include zero at virtually every individual horizon for both regimes (Figures 7, 7b). The correct claim: the GEX→Range Granger relationship is statistically supported in positive-GEX native sessions; the point IRF is consistent with compression-then-release, but the band width means the specific horizon timing is not established.
4.6 Forecast-error variance decomposition — the magnitude reality check
Statistical significance is not economic magnitude, and the FEVD makes the distinction explicit. Decomposing the h-step forecast-error variance of range (Cholesky GEX→Color→Range), the surface shocks explain a fraction of a percent of range variance everywhere — range is overwhelmingly its own-driven process at M15:
| Root | Regime | GEX-shock share (h=8) | Color-shock share | Range own |
|---|---|---|---|---|
| SPX | POS_GEX | 0.38% | 0.05% | 99.57% |
| SPX | NEG_GEX | 0.17% | 0.03% | 99.80% |
| SPX | ALL | 0.16% | 0.01% | 99.83% |
| RUT | POS_GEX | 0.09% | 0.21% | 99.70% |
| QQQ | POS_GEX | 1.18% | 0.16% | 98.67% |
| QQQ | ALL | 1.07% | 0.09% | 98.85% |
| IWM | POS_GEX | 0.25% | 0.14% | 99.61% |
| Combined native | POS_GEX | 0.06% | 0.18% | 99.76% |
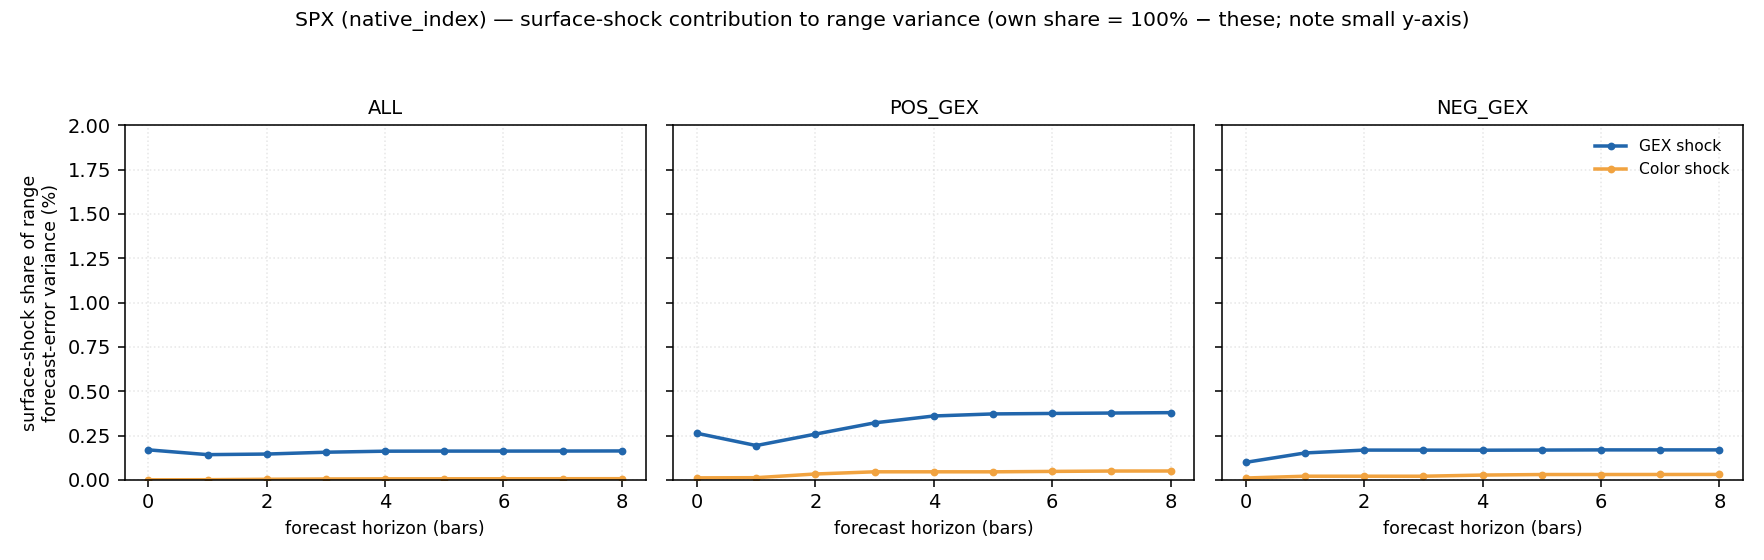
Two things matter here. First, the regime ordering is internally consistent: the GEX-shock share of range variance is highest exactly where the Granger test is significant — SPX POS_GEX (0.38% vs 0.16–0.17% elsewhere), and QQQ overall (~1.1%, the strongest surface contribution in the study and the rail with the strongest GEX→Range Granger evidence). Second, and decisively for honest framing: even where the lead-lag is real, surface shocks account for well under 1.5% of next-bars range variance. The dealer-gamma surface tilts the conditional distribution of range in a statistically detectable, regime-consistent way; it does not drive range, which is dominated by its own autocorrelation. Any practitioner reading must respect that ceiling.
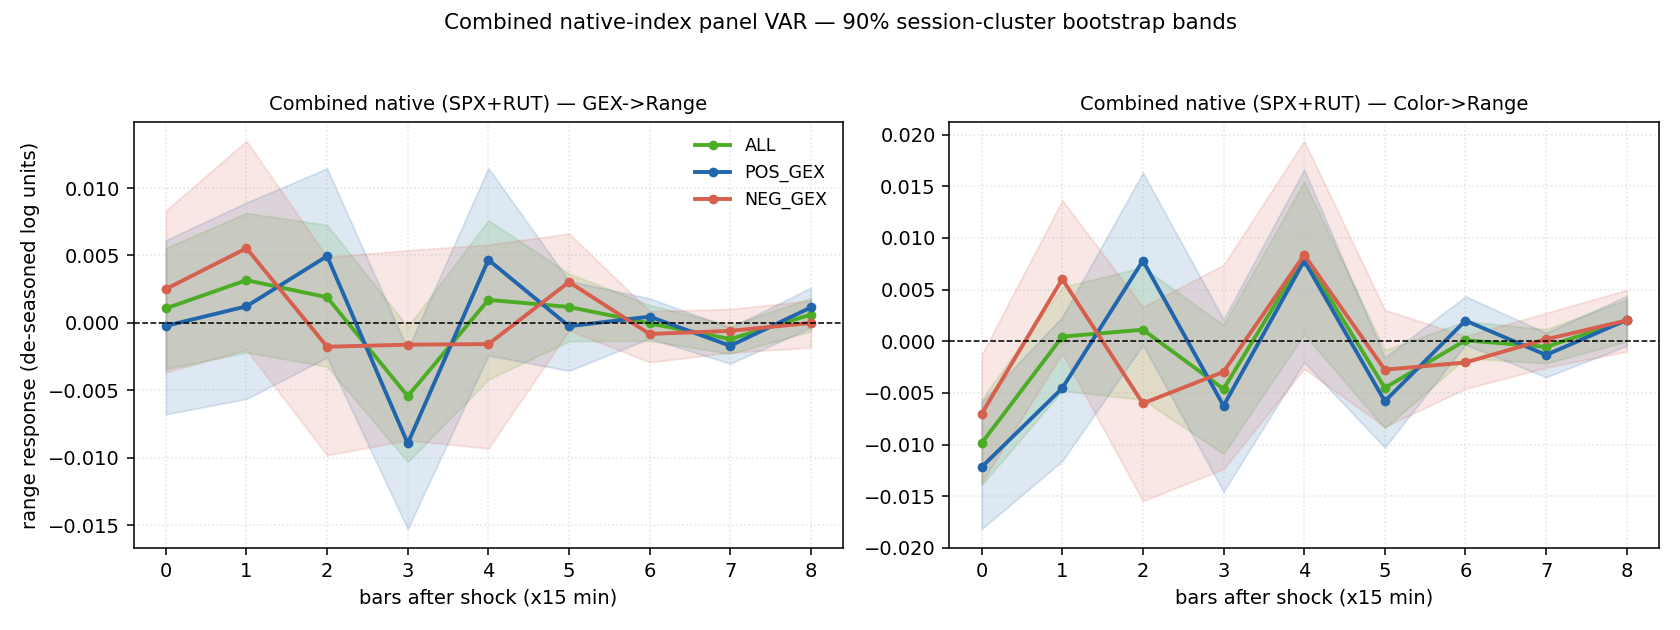
4.7 Cumulative response and combined-native panel
The cumulative (level) GEX→Range response integrates the per-bar IRF: on SPX POS_GEX the cumulative response is net-negative early (the compression accumulates) before the bar-4 release partially offsets it, ending mildly negative over 2 h — consistent with "held in, then partially let out." A combined native-index panel (SPX+RUT stacked after de-seasonalization, root identity retained) gives 27,332 rows across 1,093 sessions (POS_GEX 584 / NEG_GEX 509) — the highest-powered estimate in the program. Its banded IRFs (Figure 7) still include zero at most horizons, and its FEVD surface shares are the smallest of all (GEX 0.02–0.06%), because stacking two rails with different IRF timing partially averages the regime-specific paths. The combined panel sharpens the Granger evidence (more rows) without yet sharpening the IRF timing — the timing precision needs OI-weighting and event controls, not just more sessions.
5. Discussion
5.1 One mechanism, two horizons, with GEX sign as the state variable
The static and dynamic results tell one story. Color is the rate of change of gamma with time. A high absolute chain Color means the dealer book's gamma is reconfiguring quickly toward (or away from) a pin, most sharply for the near-dated strikes that dominate the opening surface. When |Color| is high and GEX is positive, the book's effective gamma concentrates and decays toward a pin: delta-hedging flow mean-reverts around a tightening anchor, and realized range is held in — the suppression/compression seen statically in Part I (SPXW expansion −18.79pp, balance +11.09pp) and dynamically in Part II (POS_GEX GEX→Range compression at bar 1). When Color is negative — gamma decaying in the destabilizing direction — the constraint inverts: Part I's NEGATIVE-Color cohort expands on every rail, and Part II's NEG_GEX bar-1 IRF is positive. The connecting thread, made explicit by Study 2 (the bridge), is a time-shift: a long-dealer-gamma open does not kill the day's range, it postpones it past the European close. The three results are the same dealer-gamma constraint at the opening snapshot, the morning trajectory, and the bar-by-bar interior.
This is the cross-derivative analog of the gamma-pinning channel of Ni, Pearson, and Poteshman (2005). GEX sign is the regime switch; Color is the rate-of-reconfiguration modulator inside the regime.
The FEVD (§4.6) disciplines how strong a claim this can be. The lead-lag is statistically real and regime-consistent — the GEX-shock share of range variance is largest precisely where the Granger test fires (SPX POS_GEX, QQQ) — but it is a fraction of a percent of range variance everywhere. The honest synthesis is therefore: the dealer-gamma surface tilts the conditional distribution of range (which day type is more likely, whether the constraint is tightening or releasing) in a detectable, mechanism-consistent way; it does not drive realized range, which at the M15 horizon is overwhelmingly its own autoregressive process. Part I's day-type associations are economically larger than Part II's bar-by-bar shares because Part I conditions a whole-session outcome on the opening state, whereas Part II asks the much harder bar-to-bar propagation question — and the two are consistent: a small per-bar tilt, accumulated and conditioned on regime, is exactly what produces a materially different end-of-day distribution.
5.2 Limitations
5.3 Data roadmap (ranked by leverage)
option_history/open_interest) to sharpen the surface aggregates and IRF bands — the combined native panel (§4.7) already added the rows without sharpening the timing, so the next gain must come from a cleaner surface signal, not more sessions.Out of scope / correctly refused (leave as roadmap, do not approximate): gross-gamma-denominator C/G, native-NDX confirmation, overnight value-area geometry, VIX1D term structure, scheduled-liquidity flags.
5.4 What this paper does and does not establish
It does establish: a robust, rail-replicated unconditional association between high opening-minute Color intensity (and negative Color sign) and suppressed same-session large expansion, with a complementary SPX compression tilt; that the relationship is concentrated in the positive-GEX regime; and that intraday GEX changes carry regime-conditioned Granger-predictive content for next-bar native-index range, with a universal GEX↔Color coupling.
It does not establish: a Color day-type effect net of prior-day realized range (Color loses significance under that control, §3.7b — the central negative result); causality or dealer intent; IRF timing (bands include zero) or large economic magnitude (surface FEVD <1.2%); out-of-sample edge; a native-Nasdaq claim from QQQ; or temporal stability beyond the descriptive time-split. The defensible positive claims are (i) Color/GEX as a regime classifier of the unconditional day-type distribution, (ii) GEX sign as a first-order range-regime variable, and (iii) regime-conditioned intraday GEX→range lead-lag — not Color as a controlled stand-alone day-type predictor.
6. Conclusion
Across the opening snapshot and the intraday interior, one mechanism is visible at two horizons. Unconditionally, high opening-minute net Color intensity is associated with materially suppressed same-session large expansion (SPX h=0.482, QQQ h=0.621, RUT directional), with a complementary SPX compression tilt and a consistent NEGATIVE-Color→expansion signal on all three rails; and intraday, GEX changes Granger-predict next-bar range in positive-GEX native sessions, with universal GEX↔Color coupling and a compression-then-release IRF. But two honesty checks bound the claim. First, once a prior-only prior-day realized-range control is added, Color's day-type effect loses significance on every rail — prior-day range (volatility clustering) is the dominant covariate, and Color does not beat it the way net-VEX did in the benchmark study. Second, the intraday lead-lag, while statistically real and regime-consistent, explains under ~1.2% of next-bar range variance (FEVD). The durable, defensible claims are therefore narrower than a standalone Color signal: GEX sign is a first-order range-regime variable; Color/GEX usefully classify the unconditional day-type distribution and modulate the GEX regime; and intraday GEX changes carry a small, regime-conditioned predictive tilt on range. The constraint tilts and time-shifts the range distribution; it neither drives range mechanically nor survives as an independent day-type predictor of volatility clustering. The highest-value next steps are a richer controlled model (does any surface variable beat prior-day range?), OI-weighting to sharpen the IRF, and a pre-registered held-out native slice.