Opening-Minute Vanna Exposure and Same-Session Day-Type Realization in Russell 2000 Index Options
Working paper for academic review. Not peer-reviewed; not investment advice. For informational purposes only. First in a series of working papers examining causal effects from the options surface aimed at options/futures analysts.
Abstract
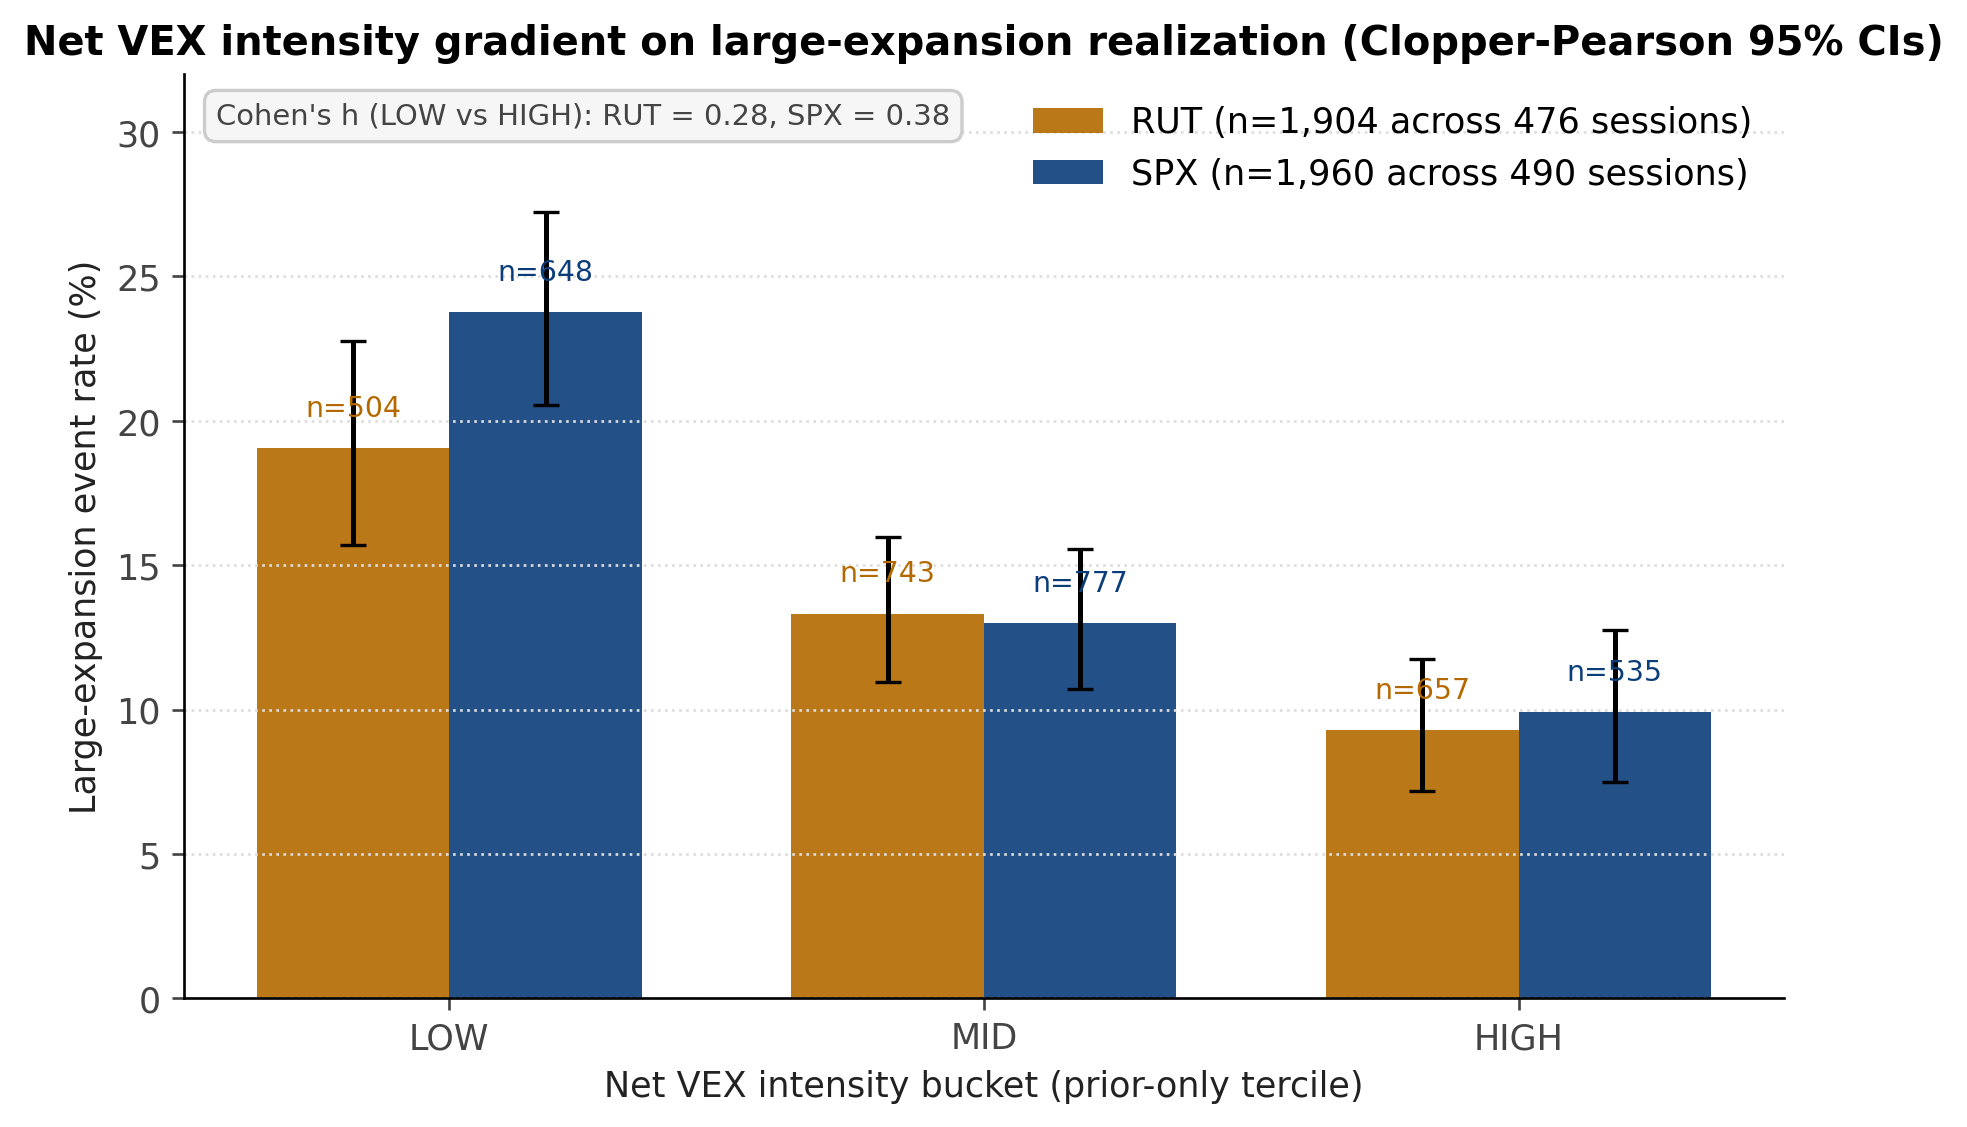
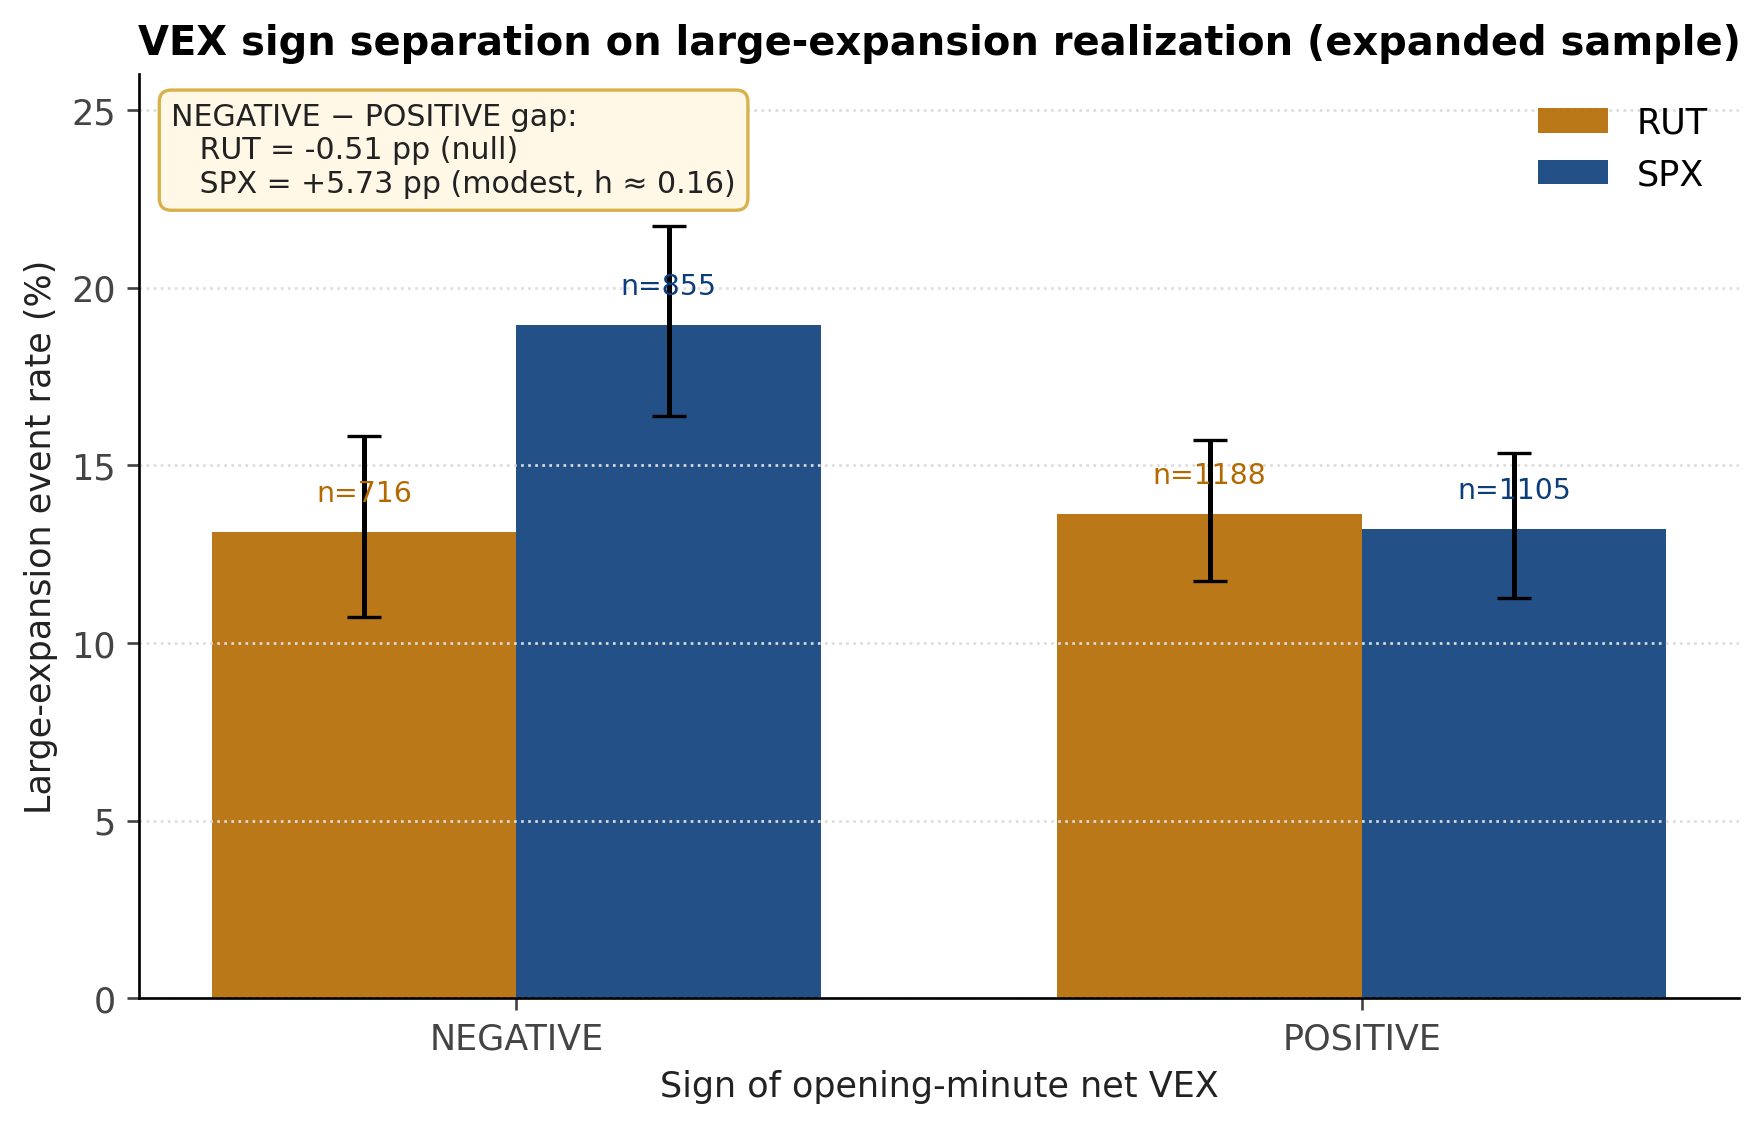
We study whether opening-minute vanna exposure structure in the Russell 2000 (RUT) index option chain is associated with same-session realized day type measured on M15 RTY futures candles. Using 1,904 row-observations across 476 trading sessions and a 20-session prior-only normalization window, we document three results. First, a percentile-ranked net VEX intensity gradient is associated with large-expansion realization in a monotonic and economically large fashion: pooled across the 09:31-09:34 ET feature windows, the LOW intensity cohort realizes 19.05% large-expansion days (n=504), MID 13.32% (n=743), and HIGH 9.28% (n=657). Cohen's h on the LOW-vs-HIGH contrast is 0.29 (small-to-medium); a session-cluster bootstrap places the LOW-minus-HIGH gap at 9.76 percentage points with a 95% interval of [2.66, 17.01], and a session-level permutation test gives p=0.0067. The direction is preserved at every individual opening minute and survives a post-09:45 sensitivity outcome that removes the M15 bar containing the features. Second, the signed direction of net VEX is not informative for large-expansion realization on this rail (NEGATIVE 13.13%, n=716; POSITIVE 13.64%, n=1,188; gap -0.51 percentage points; cluster-bootstrap 95% interval [-5.26, 4.51], permutation p=0.8603). Third, a partially-controlled logistic specification including prior-day realized range, opex-cycle bucket, prior-session expansion state, GEX sign and magnitude, IV-percentile bucket, and day-of-week retains a positive net VEX intensity coefficient (beta = +0.45 standardized) and, separately, a non-trivial positive coefficient on GEX-positive (beta = +0.63). The dominant covariate in the partial model is the autoregressive prior-day range (beta = +2.87). The relation between net VEX intensity and true-balance realization is positive in the combined sample (HIGH 23.29%, LOW 16.47%) but has a clustered interval crossing zero and is not stable across cohort subsamples; it is therefore reported as a sample-dependent secondary finding. We interpret the stable expansion result as consistent with a dealer cross-derivative hedging interpretation, although the controls are not yet sufficient to identify it.
Keywords: index options, vanna exposure, dealer hedging, intraday range, day-type taxonomy, Russell 2000.
1. Introduction
The literature on option-market demand pressure and its effect on the underlying has, since Garleanu, Pedersen, and Poteshman (2009) and Bollen and Whaley (2004), supported the view that aggregate option-market positioning can transmit to realized price behavior in the underlying through dealer hedging. The strongest empirical anchors involve net buying pressure, expiration-day gamma pinning (Ni, Pearson, and Poteshman, 2005), and 0DTE gamma exposure (Pearson and Sosi, 2024). Vanna - the cross-partial derivative of delta with respect to volatility - has received less formal empirical attention, in part because its measurement is sensitive to the assumed volatility surface and in part because its dealer-hedging channel is harder to identify cleanly than the gamma channel.
This paper isolates one narrow empirical question. Conditional on the opening-minute RUT option-surface state, measured at four distinct minute snapshots between 09:31 and 09:34 ET, is the same-session distribution of broad day-type outcomes different across cohorts defined by vanna-surface intensity and signed vanna direction? The empirical object is not directional forward-looking claim accuracy. It is a conditional association between the opening surface and a coarse range/shape outcome derived from M15 RTY futures candles. The opening minute is chosen as a proxy for the opening range; typically before the majority of the RTH range has been established. We test the three subsequent minutes to act as a comparison.
We make three contributions. First, we document a stable, monotonic gradient of large-expansion realization in net VEX intensity that holds across all four opening windows and across primary and post-09:45 sensitivity outcomes. Second, we document a null on signed VEX direction for the same outcome, which disciplines a common practitioner reading that conflates VEX intensity and VEX sign. Third, we report a partially-controlled logistic diagnostic in which the net VEX intensity coefficient remains positive after the autoregressive prior-day range, the opex-cycle bucket, the prior-session expansion state, and day-of-week effects are held fixed. We also flag a secondary finding - the relation between net VEX intensity and true-balance realization - as sample-dependent rather than robust, on the basis of subsample stability accounting that we describe in Section 7.
The rest of the paper is structured as follows. Section 2 describes the data and feature construction. Section 3 lays out the day-type taxonomy and the prior-only baseline methodology. Section 4 specifies the inferential plan. Section 5 reports primary results. Section 6 reports the post-09:45 sensitivity analysis. Section 7 reports the subsample stability decomposition. Section 8 reports the partially-controlled logistic diagnostic. Section 9 discusses interpretation. Section 10 concludes.
2. Data
2.1 Sample
The feature side is the RUT_NATIVE option chain at four opening-minute snapshots per session: OPENING_0931, OPENING_0932, OPENING_0933, and OPENING_0934 ET. After the prior-only normalization gate, sample-coverage gate, and futures-session completeness gate, the design matrix contains 1,904 row-observations across 476 trading sessions. Each session contributes up to four observations. We acknowledge the resulting within-session clustering and address it in Section 4.
2.2 Features
Two opening-minute features are central to the analysis.
Net VEX intensity is a prior-only percentile-ranked intensity measure of the vanna surface. At each timestamp t, the absolute net vanna exposure of the chain is referenced against its empirical distribution across sessions t-20 through t-1, and assigned to a LOW (bottom prior-ranked bucket), MID, or HIGH (top prior-ranked bucket) bucket using prior-only cutpoints. The 20-session window is chosen to maximize usable sample size under strict prior-only discipline. Section 4.3 discusses the trade-off against longer windows.
VEX sign is the signed direction of the net VEX integral at the corresponding minute snapshot. NEGATIVE and POSITIVE cohorts are kept separate; negative VEX is not collapsed into low intensity.
Auxiliary features carried into the partial logistic specification of Section 8 are: GEX sign (POSITIVE/NEGATIVE), GEX magnitude bucket (LOW/MID/HIGH prior-ranked buckets, prior-only), IV percentile (rank against prior 20 sessions), opex-cycle bucket (0DTE_WEEKLY_OPEX / WEEKLY_OPEX / MONTHLY_OPEX / OTHER), days-to-opex, prior-session expansion state, prior-day realized range (as a percentage of prior baseline), and day-of-week.
Open-interest coverage (oiCoverage) is retained as a chain-data quality diagnostic only; it is not used as a positioning-intensity control. Total open interest is not yet joined to the design matrix.
2.3 Outcome
Throughout the paper, the headline binary endpoint is LARGE_EXPANSION only: a same-session M15 range multiple >= 1.5 versus the prior-only session-range baseline. MODERATE_EXPANSION is retained as a descriptive day-type class, but it is not counted in the headline event numerator.
The outcome rail is the RTY M15 futures candle series. Each session is classified into one of five labels using the M15 range multiple (realized range scaled by a prior-only baseline) and the close-location coordinate (close minus low divided by high minus low):
The two primary binary endpoints used throughout this paper are LARGE_EXPANSION (the headline expansion event) and TRUE_BALANCE (the headline compression event). The remaining three labels are descriptive and are not used as numerators in the headline contrasts.
The unconditional day-type distribution in the sample is:
| Day type | n | Share |
|---|---|---|
| LARGE_EXPANSION | 256 | 13.45% |
| MODERATE_EXPANSION | 360 | 18.91% |
| TRUE_BALANCE | 368 | 19.33% |
| DIRECTIONAL_CLOSE | 660 | 34.66% |
| NORMAL_ROTATION | 260 | 13.66% |
The unconditional large-expansion base rate is 13.45%. All binary event-rate contrasts in this paper should be read against this base rate, not against an expansion-broadly-defined rate of approximately 32.36%.
3. Day-Type Taxonomy and Prior-Only Baselines
The day-type taxonomy is fixed in advance and does not vary by feature cohort. Range multiple and close location are derived from M15 RTY futures candles, with the range multiple referenced to a 20-session prior-only baseline. The taxonomy thresholds (1.5, 1.1, 0.8, [0.25, 0.75]) are chosen ex ante to separate range size from close-location shape. They are not optimized.
The prior-only construction is strict. At session t, the threshold cutpoints for net VEX intensity and the baseline for the range multiple are computed using only sessions t-20 through t-1. No same-session feature, outcome, or magnitude information enters the baseline that classifies the same session. The early-period attrition cost is documented in the refusal accounting:
| Refusal reason | Rows |
|---|---|
| INSUFFICIENT_NORMALIZATION_HISTORY | (early period) |
| INSUFFICIENT_PRIOR_RANGE_HISTORY | (early period) |
| FUTURES_SESSION_INCOMPLETE | (sparse) |
| INSUFFICIENT_FEATURE_COVERAGE | (sparse) |
These refusals are absorbed before the 1,904-row design matrix is constructed.
4. Inferential Plan
4.1 Layers
The inferential plan has three layers and is pre-specified.
The first layer is the conditional cross-tab. For each opening window, we report the binary event rate of LARGE_EXPANSION and TRUE_BALANCE separately by net VEX intensity bucket and by VEX sign cohort, with Wilson 95% confidence intervals for each cell.
The second layer is the pooled-across-windows summary. Because the four windows are not independent - they share session identity - naive pooling overstates sample size. We address this in two ways: we report the pooled point estimates and CIs alongside a note on within-session clustering; and we require that the cross-window monotonicity of the gradient hold independently at each of the four windows before treating the pooled estimate as evidence. The pooled effect-size estimate (Cohen's h) is computed on the pooled rates.
The third layer is a partially-controlled logistic specification. The pre-specified specification regresses the binary endpoint on a standardized continuous net VEX intensity percentile, VEX sign indicator, GEX sign and magnitude indicators, IV-percentile-bucket indicators, opex-cycle-bucket indicators, days-to-opex, prior-session expansion state, prior-day realized range, and day-of-week indicators. Standard errors are computed without clustering for the headline coefficients; we treat the coefficients as descriptive rather than as causal estimates.
As a reviewer-facing robustness layer, we also compute session-cluster bootstrap intervals for the pooled cohort gaps and a session-level permutation test that shuffles session outcomes across fixed opening-window feature rows. These tests preserve the within-session dependence created by four rows per trading day. They are reported as finite-sample diagnostics rather than as a full replacement for clustered standard errors in the multivariable model.
4.2 Multivariable identification
The partial logistic specification omits four controls that we believe are material for full identification: total open interest, VIX-regime bucket, scheduled event-day flags, and a richer opex calendar that distinguishes major monthly expirations from minor weeklies beyond the binary 0DTE/weekly/monthly bucket used here. The logistic results in Section 8 should therefore be read as a partial decomposition, not as a fully identified causal estimate.
4.3 Lookback choice and sensitivity
The 20-session prior-only normalization window is the binding sample-construction constraint. Both the RUT rail and the companion SPX rail use this same 20-session prior-only lookback for the publication comparison, so the cross-index figure is not a 20-versus-320-window comparison. Shorter windows would not provide a stable prior baseline; longer windows would reduce the usable sample without changing the conceptual target. The cell-level event-rate gradients reported below are stable across the four opening windows, which is the within-design analog of a lookback robustness test: each window has its own attrition profile but produces the same monotonicity. A formal cross-lookback robustness exercise is part of the data roadmap (Section 9.3).
5. Primary Results
5.1 Large expansion by net VEX intensity
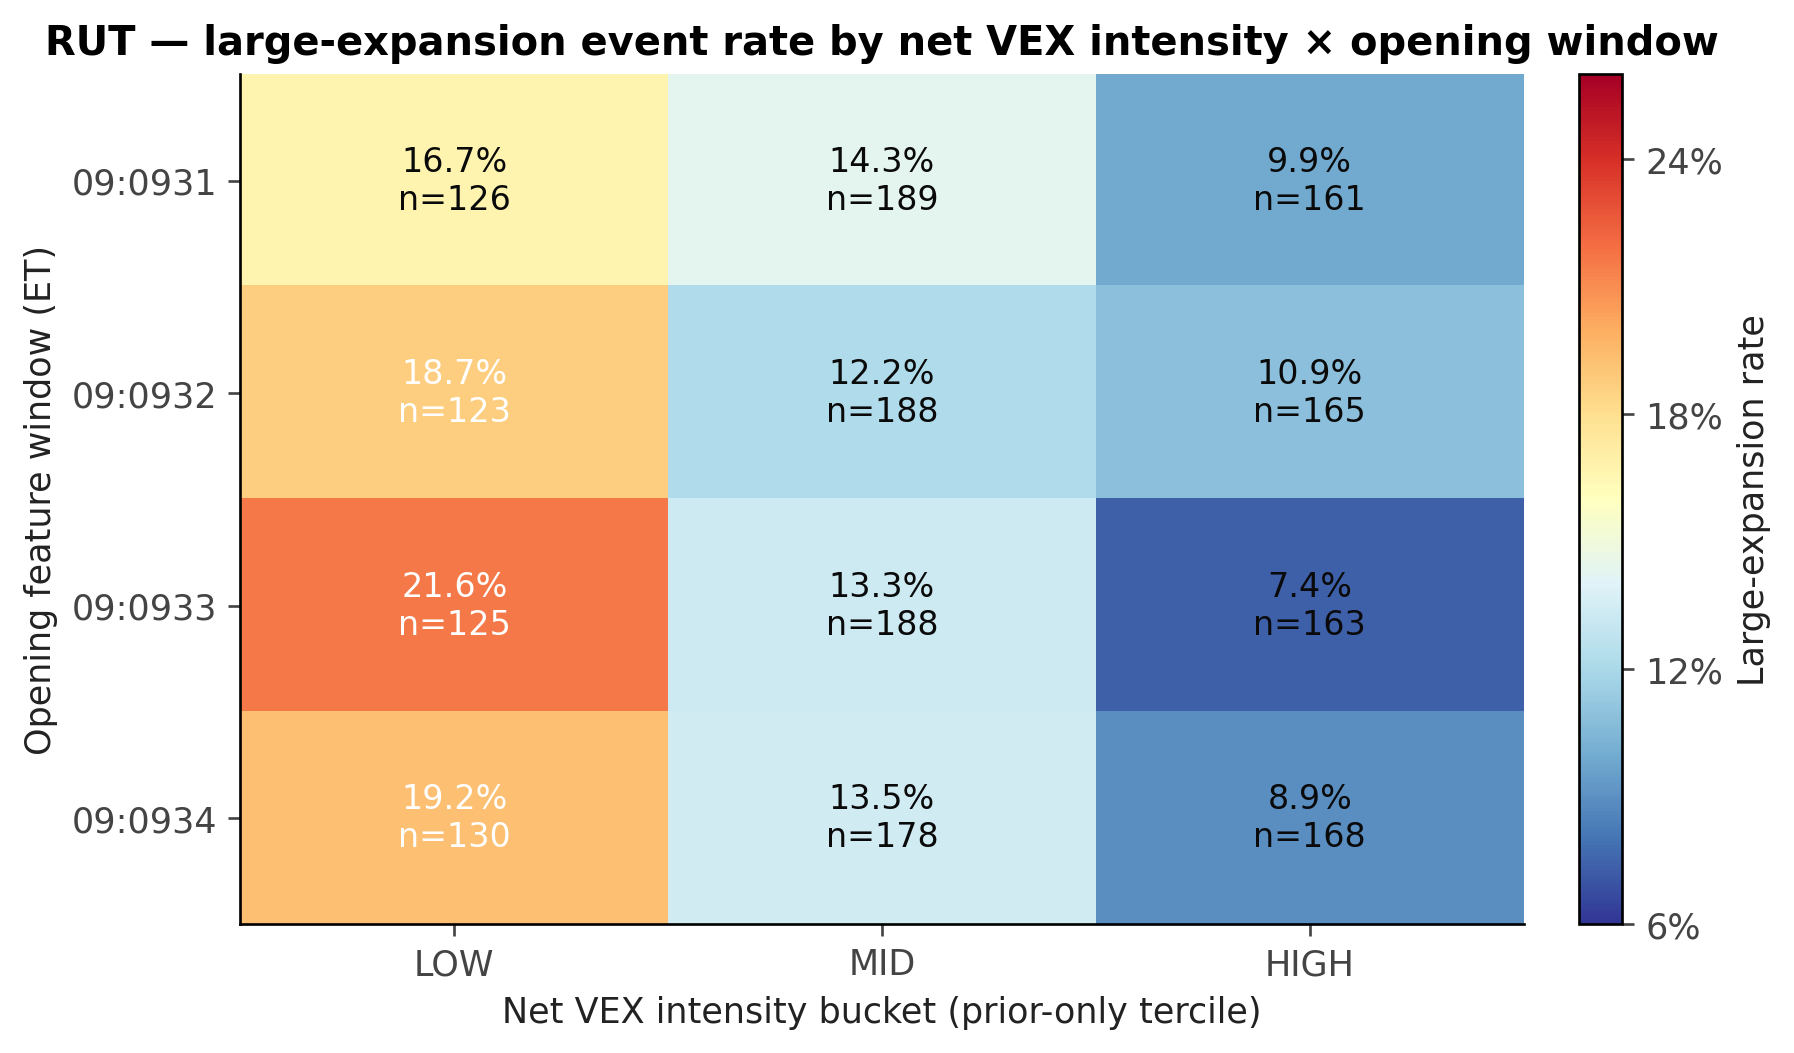
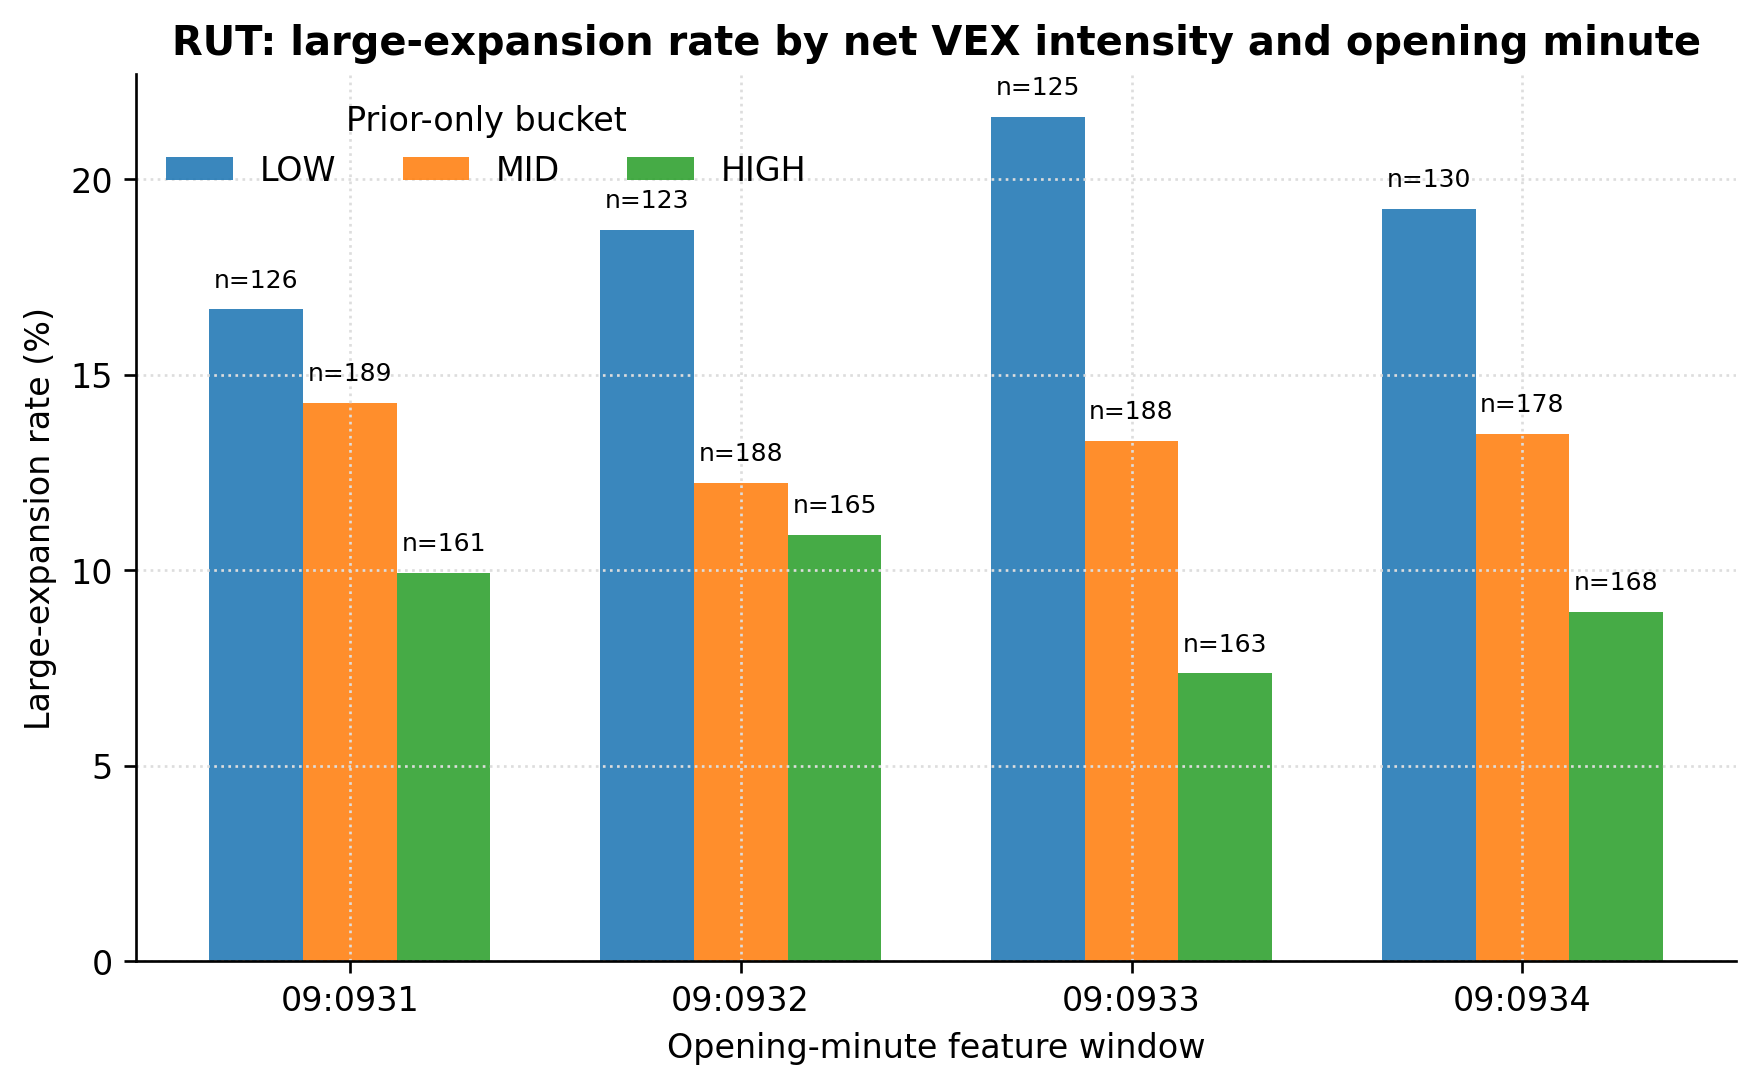
The headline cell-level event-rate table, with Wilson 95% intervals, is:
| Window | Bucket | n | Events | Rate | 95% CI |
|---|---|---|---|---|---|
| 09:31 | LOW | 126 | 21 | 16.67% | [11.21%, 24.11%] |
| 09:31 | MID | 189 | 27 | 14.29% | [10.00%, 19.97%] |
| 09:31 | HIGH | 161 | 16 | 9.94% | [6.21%, 15.53%] |
| 09:32 | LOW | 123 | 23 | 18.70% | [12.79%, 26.51%] |
| 09:32 | MID | 188 | 23 | 12.23% | [8.31%, 17.69%] |
| 09:32 | HIGH | 165 | 18 | 10.91% | [7.00%, 16.60%] |
| 09:33 | LOW | 125 | 27 | 21.60% | [15.30%, 29.61%] |
| 09:33 | MID | 188 | 25 | 13.30% | [9.18%, 18.88%] |
| 09:33 | HIGH | 163 | 12 | 7.36% | [4.27%, 12.42%] |
| 09:34 | LOW | 130 | 25 | 19.23% | [13.38%, 26.83%] |
| 09:34 | MID | 178 | 24 | 13.48% | [9.20%, 19.34%] |
| 09:34 | HIGH | 168 | 15 | 8.93% | [5.49%, 14.21%] |
Pooled across windows:
| Bucket | n | Events | Rate | 95% CI |
|---|---|---|---|---|
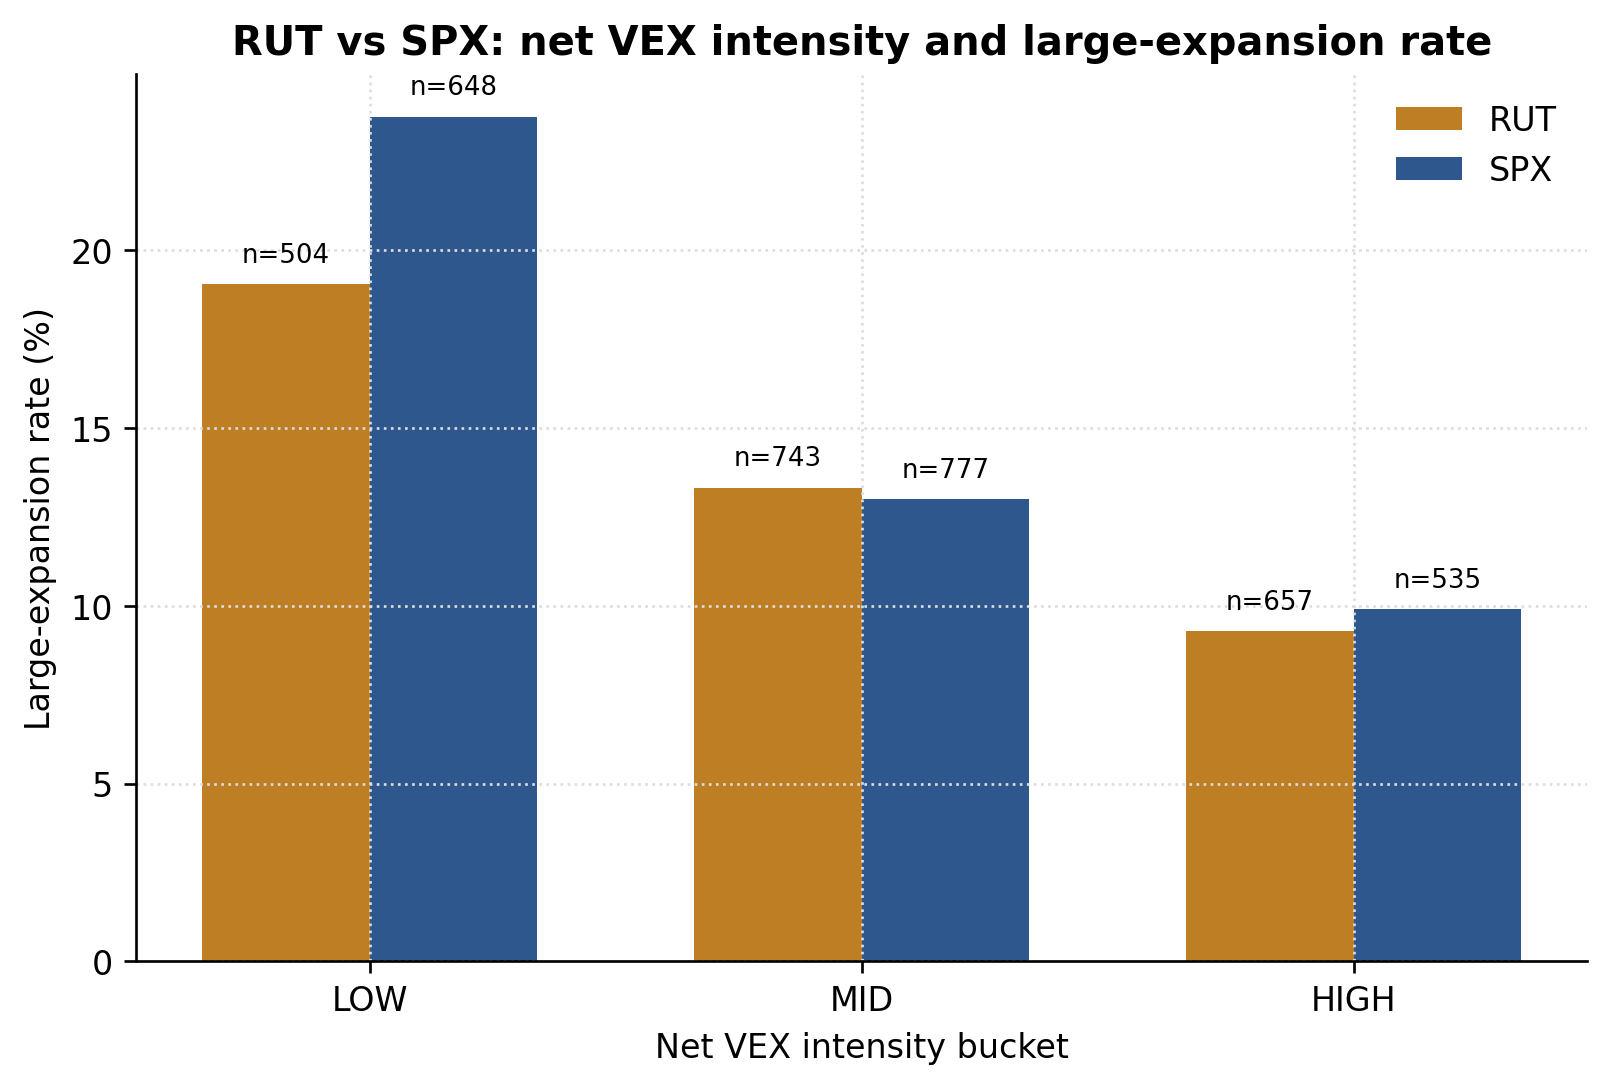
| LOW | 504 | 96 | 19.05% | [15.81%, 22.78%] |
| MID | 743 | 99 | 13.32% | [11.06%, 15.99%] |
| HIGH | 657 | 61 | 9.28% | [7.27%, 11.79%] |
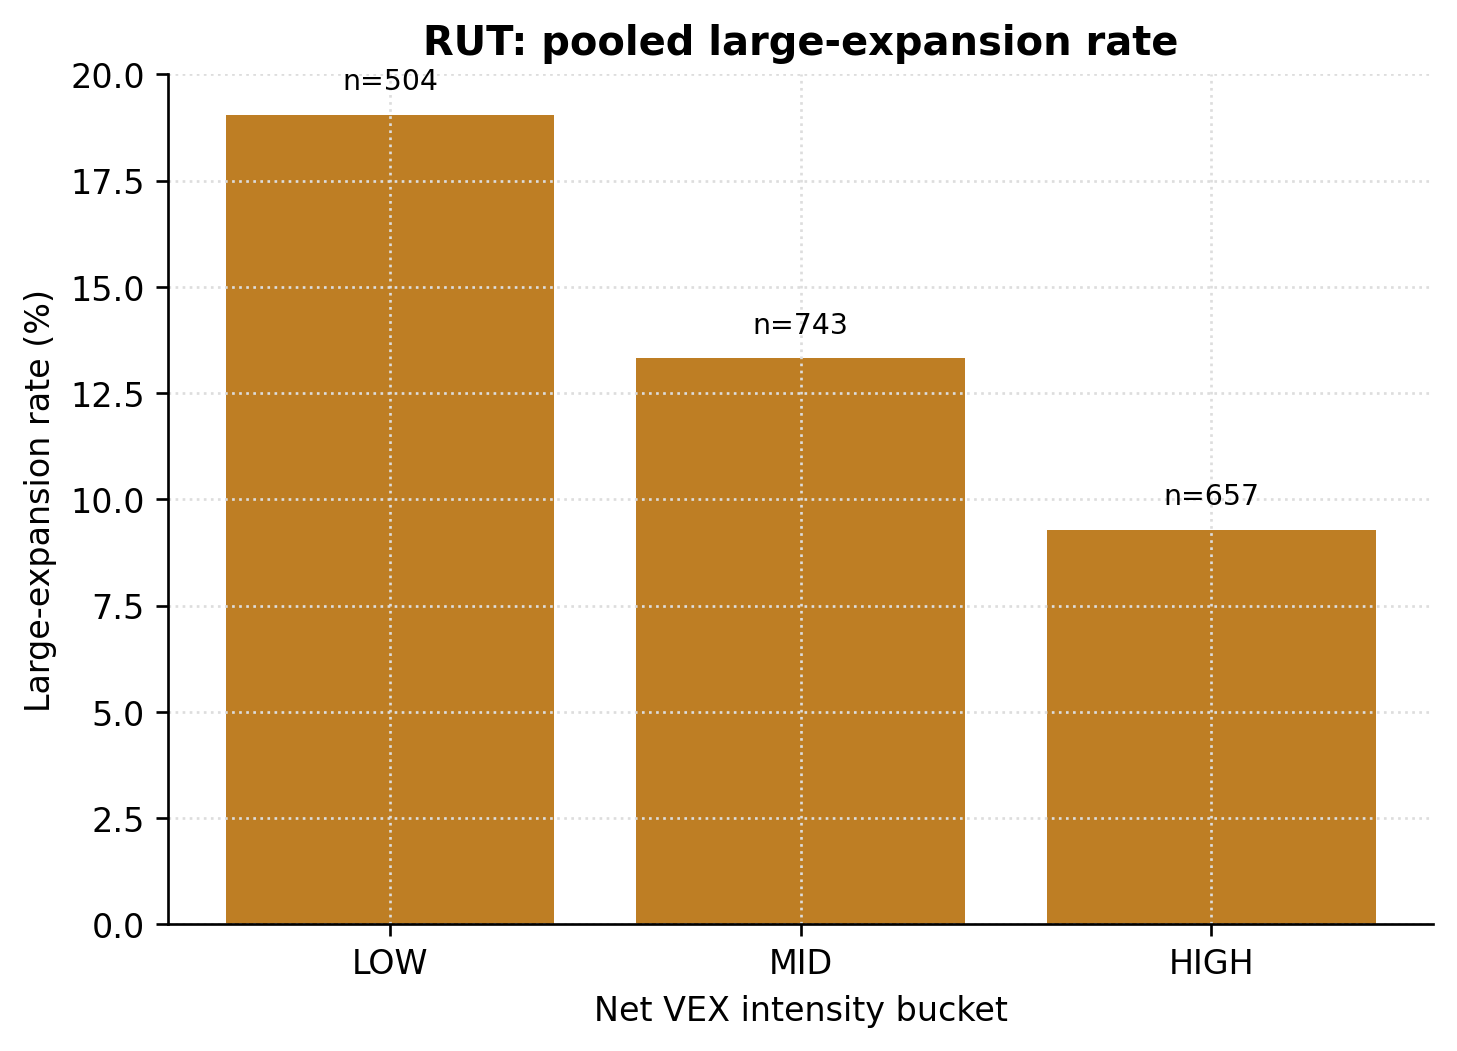
The pooled cohort arithmetic reconciles to the unconditional base rate: 96 + 99 + 61 = 256 large-expansion rows, and 504 + 743 + 657 = 1,904 total rows, matching the 13.45% base rate reported in Section 2.3.
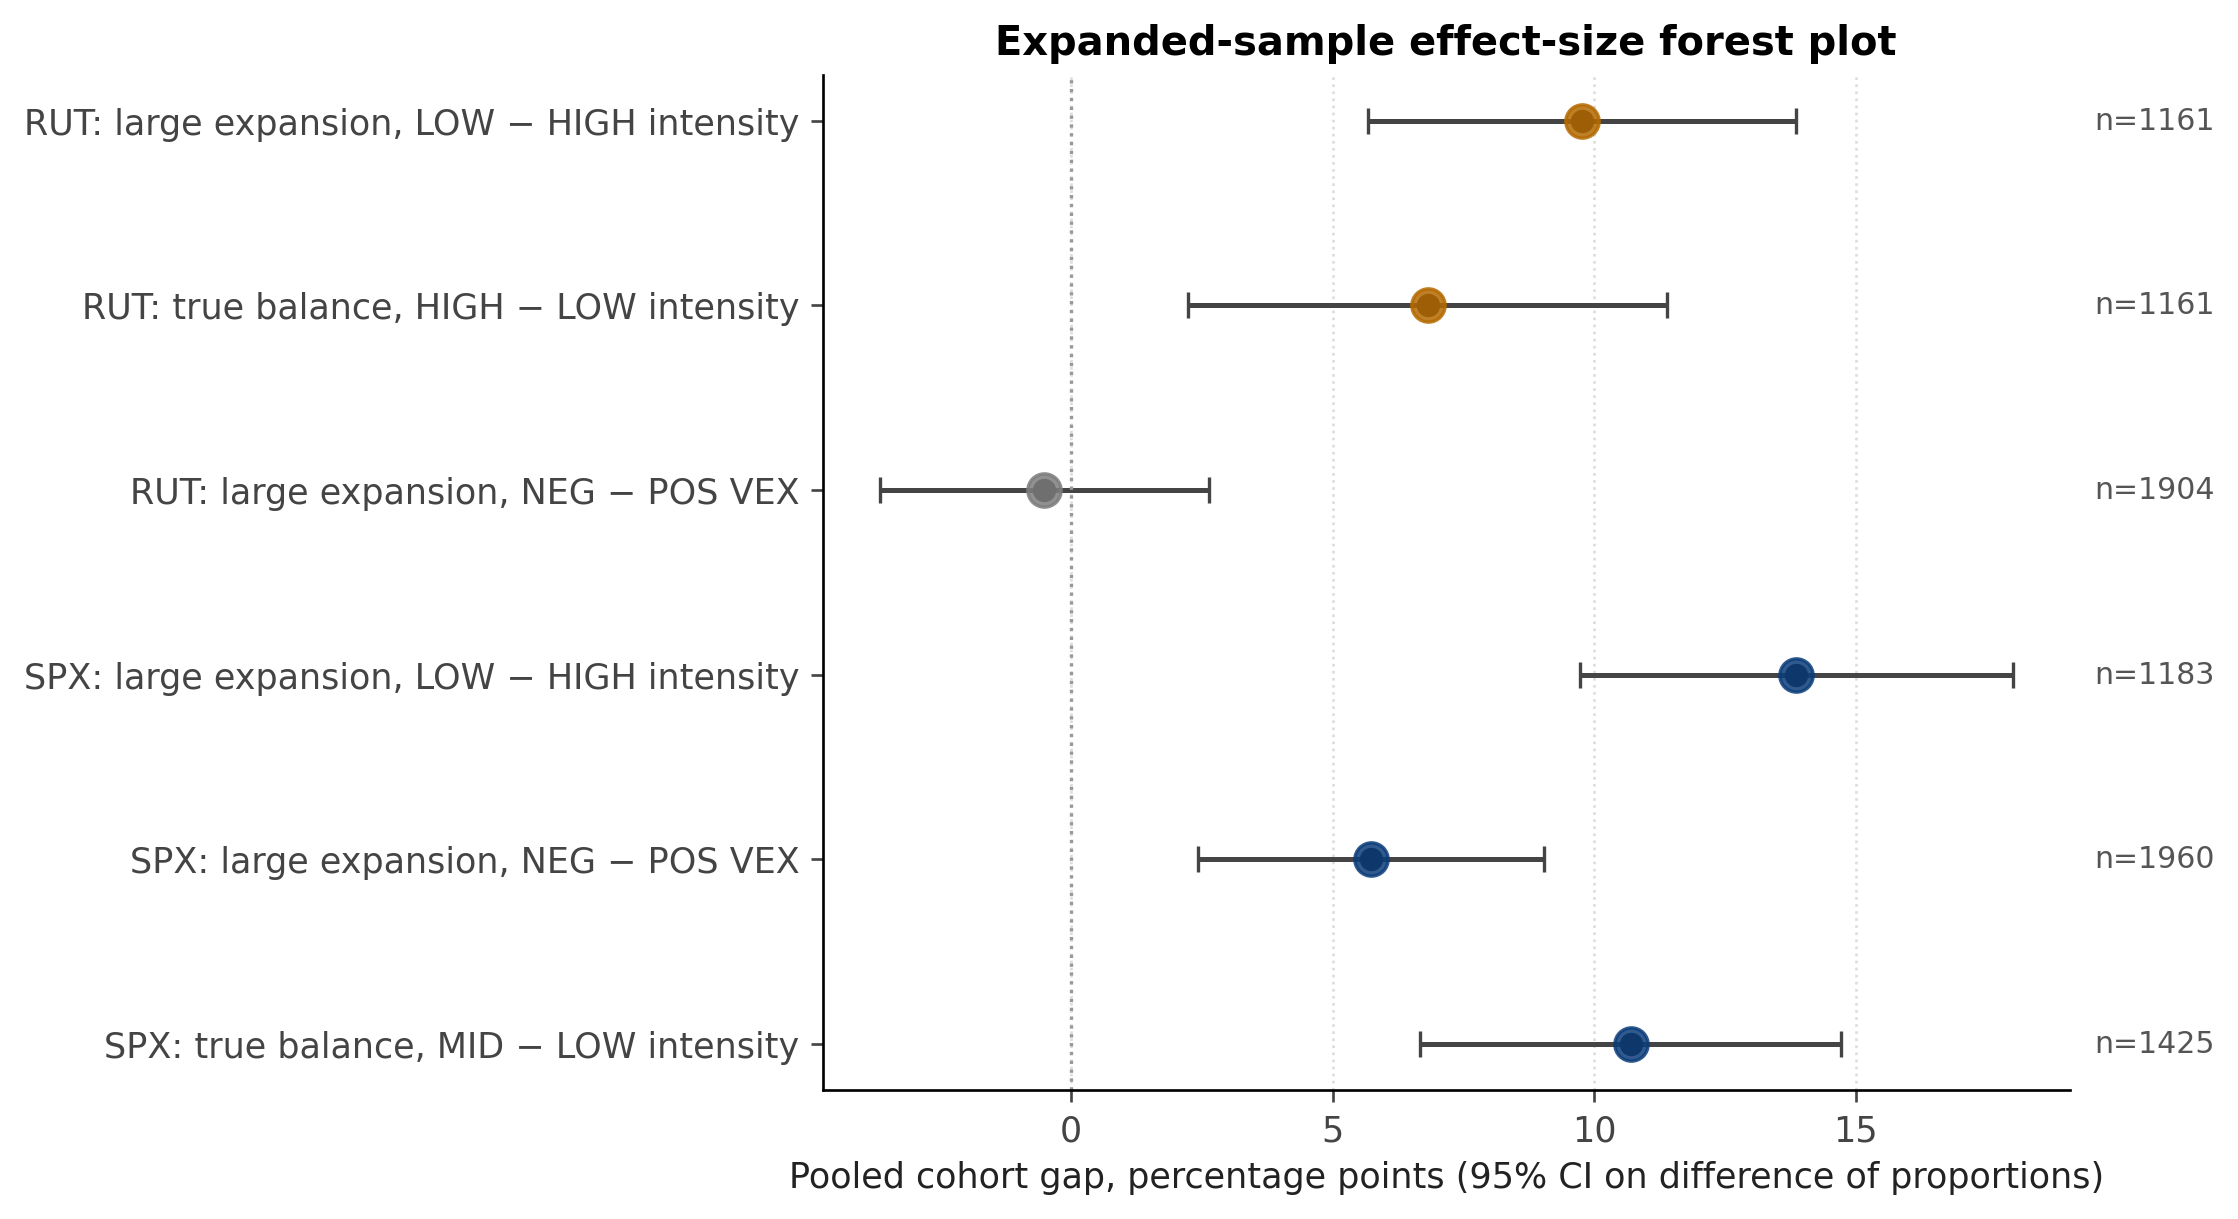
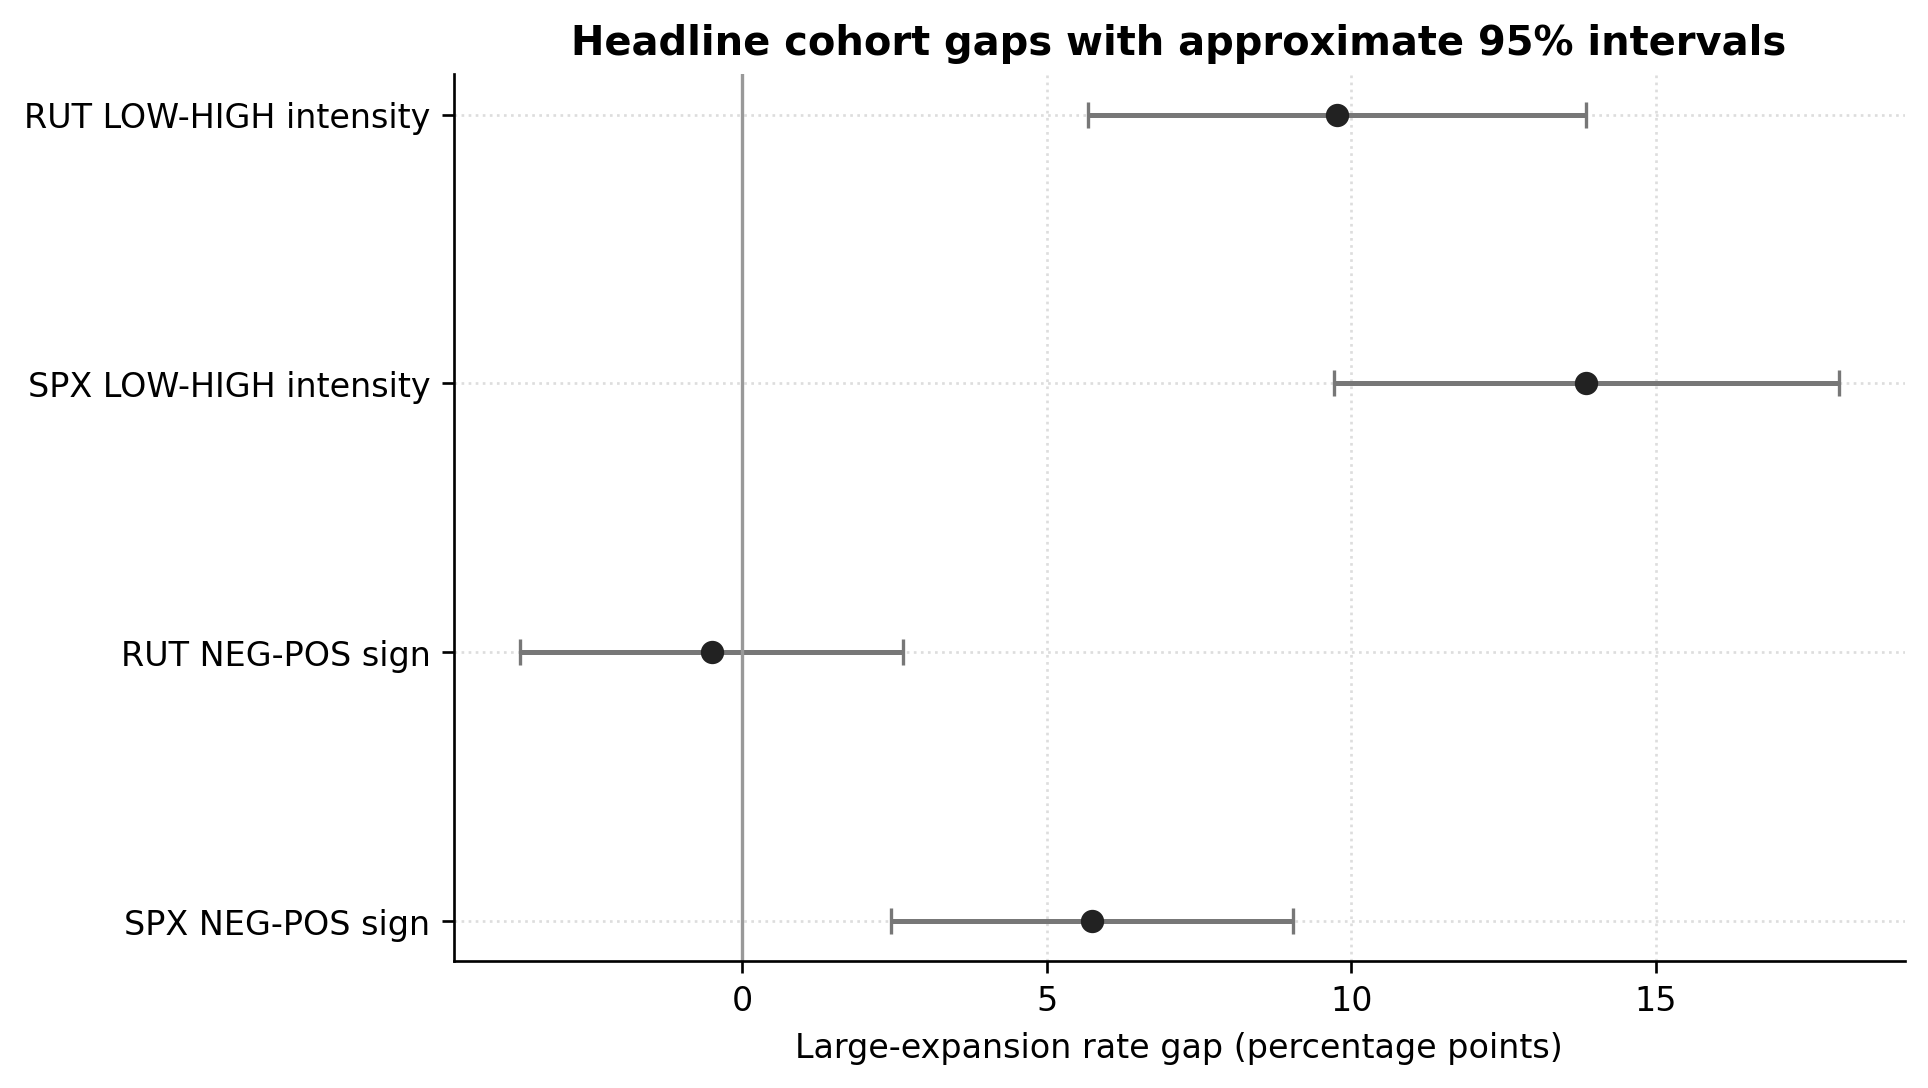
The monotonicity LOW > MID > HIGH is preserved at every individual opening window. The LOW-vs-HIGH gap is 9.77 percentage points pooled (Cohen's h = 0.29). The MID-vs-HIGH gap is 4.04 percentage points; the LOW-vs-MID gap is 5.73 percentage points. A session-cluster bootstrap on the LOW-vs-HIGH contrast produces a 95% interval of [2.66, 17.01] percentage points, and a session-level permutation test gives p=0.0067. The pooled gradient is therefore not a sample-size artifact of a single window or a single boundary, while still requiring clustered treatment in any formal multivariable submission.
5.2 Large expansion by VEX sign
The signed-direction cohort table:
| Window | Sign | n | Events | Rate |
|---|---|---|---|---|
| 09:31 | NEGATIVE | 175 | 25 | 14.29% |
| 09:31 | POSITIVE | 301 | 39 | 12.96% |
| 09:32 | NEGATIVE | 165 | 23 | 13.94% |
| 09:32 | POSITIVE | 311 | 41 | 13.18% |
| 09:33 | NEGATIVE | 175 | 19 | 10.86% |
| 09:33 | POSITIVE | 301 | 45 | 14.95% |
| 09:34 | NEGATIVE | 201 | 27 | 13.43% |
| 09:34 | POSITIVE | 275 | 37 | 13.45% |
Pooled: NEGATIVE 94/716 (13.13%); POSITIVE 162/1,188 (13.64%). The pooled gap is -0.51 percentage points and is the wrong sign relative to the practitioner reading that negative VEX is associated with elevated expansion. The window-level signs are mixed and not stable. The correct conclusion on this rail is that the signed direction of net VEX is not informative for large-expansion realization at the M15 resolution.
5.3 True balance by net VEX intensity
The pooled true-balance table:
| Bucket | n | Events | Rate |
|---|---|---|---|
| LOW | 504 | 83 | 16.47% |
| MID | 743 | 132 | 17.77% |
| HIGH | 657 | 153 | 23.29% |
Pooled HIGH-vs-LOW gap: +6.82 percentage points in the direction consistent with a structural compression interpretation. The reviewer-facing cluster check is weaker than the expansion result: the session-cluster bootstrap interval is [-1.16, 15.08] percentage points and the session-permutation p-value is 0.1033. Section 7 examines subsample stability before this finding is granted headline status.
6. Sensitivity: Post-09:45 Outcome
The post-09:45 sensitivity outcome excludes the M15 bar containing the feature windows and applies the same five-class taxonomy to the post-09:45 portion of the session. The large-expansion gradient on net VEX intensity is preserved and modestly strengthens:
| Bucket | n | Events | Rate (post-09:45) |
|---|---|---|---|
| LOW | 504 | 107 | 21.23% |
| MID | 743 | 104 | 14.00% |
| HIGH | 657 | 65 | 9.89% |
The LOW-vs-HIGH gap widens to 11.34 percentage points. The session-cluster bootstrap interval is [3.75, 19.07] percentage points and the session-level permutation p-value is 0.0013. The VEX-sign null persists. The robustness of the large-expansion gradient to this contamination-reduced outcome is, in our view, the strongest evidence in the paper against a mechanical opening-bar interpretation of the feature/outcome link.
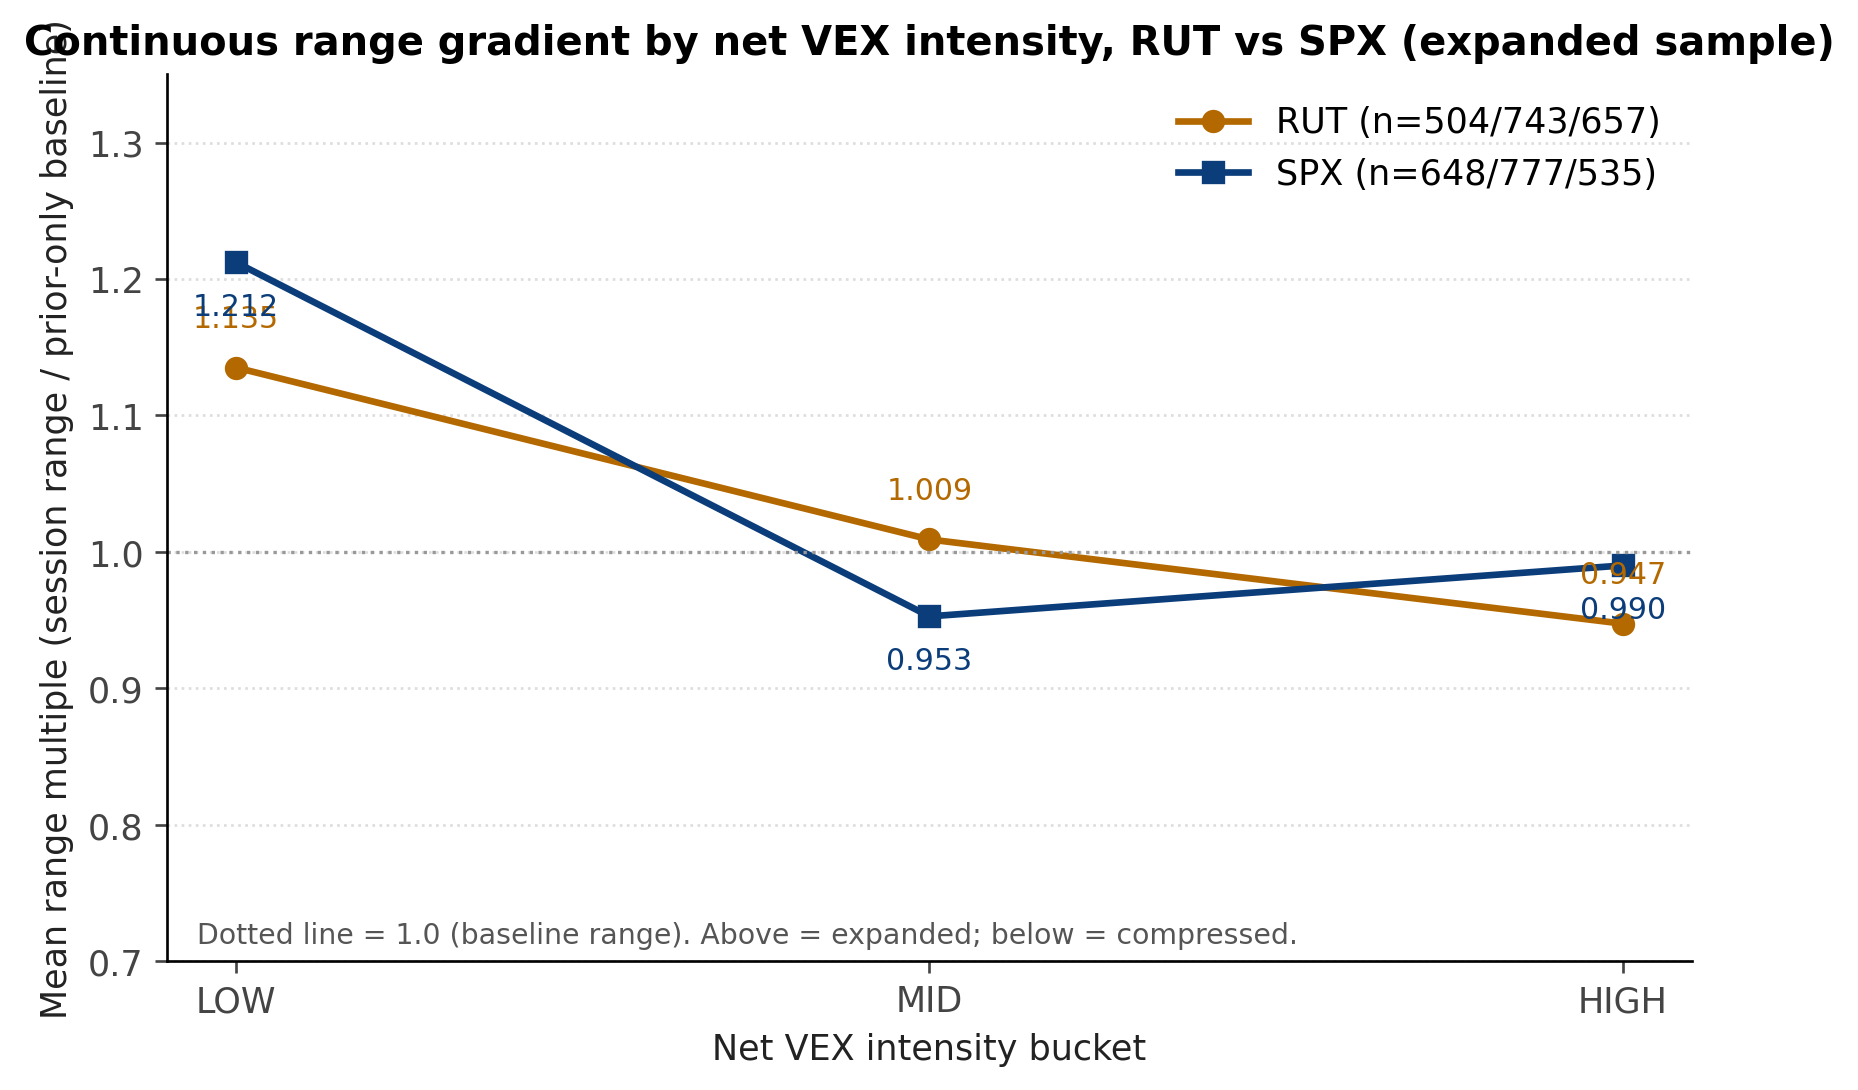
Primary and sensitivity labels agree on 1,828 of 1,904 paired rows (96.01%) when both endpoints are taken as binary LARGE_EXPANSION OR not. The four-cell agreement table is:
| Cell | Count |
|---|---|
| P_EXP & S_EXP | 228 |
| P_EXP & S_NON | 28 |
| P_NON & S_EXP | 48 |
| P_NON & S_NON | 1,600 |
7. Subsample Stability
The 1,904-row design matrix decomposes into two cohorts: 1,508 rows from the original study collection and 396 rows from a subsequent overnight collection cohort. The two cohorts share the protocol but were collected at different periods. We use the decomposition as a within-sample stability check.
For net VEX intensity -> large expansion, both cohorts produce the same direction (HIGH < LOW in primary; HIGH < LOW in sensitivity). The conclusion in Section 5.1 is robust to cohort subsampling.
For net VEX intensity -> true balance, the two cohorts disagree on direction. The original cohort produces HIGH > LOW (the compression direction consistent with structural reading). The new cohort produces HIGH < LOW (the opposite). The combined-sample direction in Section 5.3 (HIGH > LOW) is therefore preserved by the original cohort's weight and is not robust to cohort subsampling. We classify this finding as sample-dependent and report it in the secondary endpoints section rather than as a headline result.
For VEX sign -> large expansion, the null reported in Section 5.2 holds in both cohorts.
The stability decomposition table:
| Outcome family | Endpoint | Stability | Old direction | New direction | Combined direction |
|---|---|---|---|---|---|
| primary | LARGE_EXPANSION | DIRECTION_CONSISTENT | HIGH < LOW | HIGH < LOW | HIGH < LOW |
| primary | TRUE_BALANCE | DIRECTION_DIFFERENT | HIGH > LOW | HIGH < LOW | HIGH > LOW |
| sensitivity | LARGE_EXPANSION | DIRECTION_CONSISTENT | HIGH < LOW | HIGH < LOW | HIGH < LOW |
| sensitivity | TRUE_BALANCE | DIRECTION_DIFFERENT | HIGH > LOW | HIGH < LOW | HIGH > LOW |
We treat this decomposition as a methodological feature of the paper, not as a problem.
8. Partial Logistic Diagnostic
Sign-convention audit note: net_vex_intensity_percentile_20 is not inverted; higher values mean a higher prior-only rank for net VEX intensity. The positive adjusted coefficient in the partial logistic is a continuous, covariate-conditioned diagnostic, not the same estimand as the LOW-versus-HIGH bucket comparison. It should therefore be read as an appendix-level robustness diagnostic rather than as a monotonic restatement of the headline bucket result.
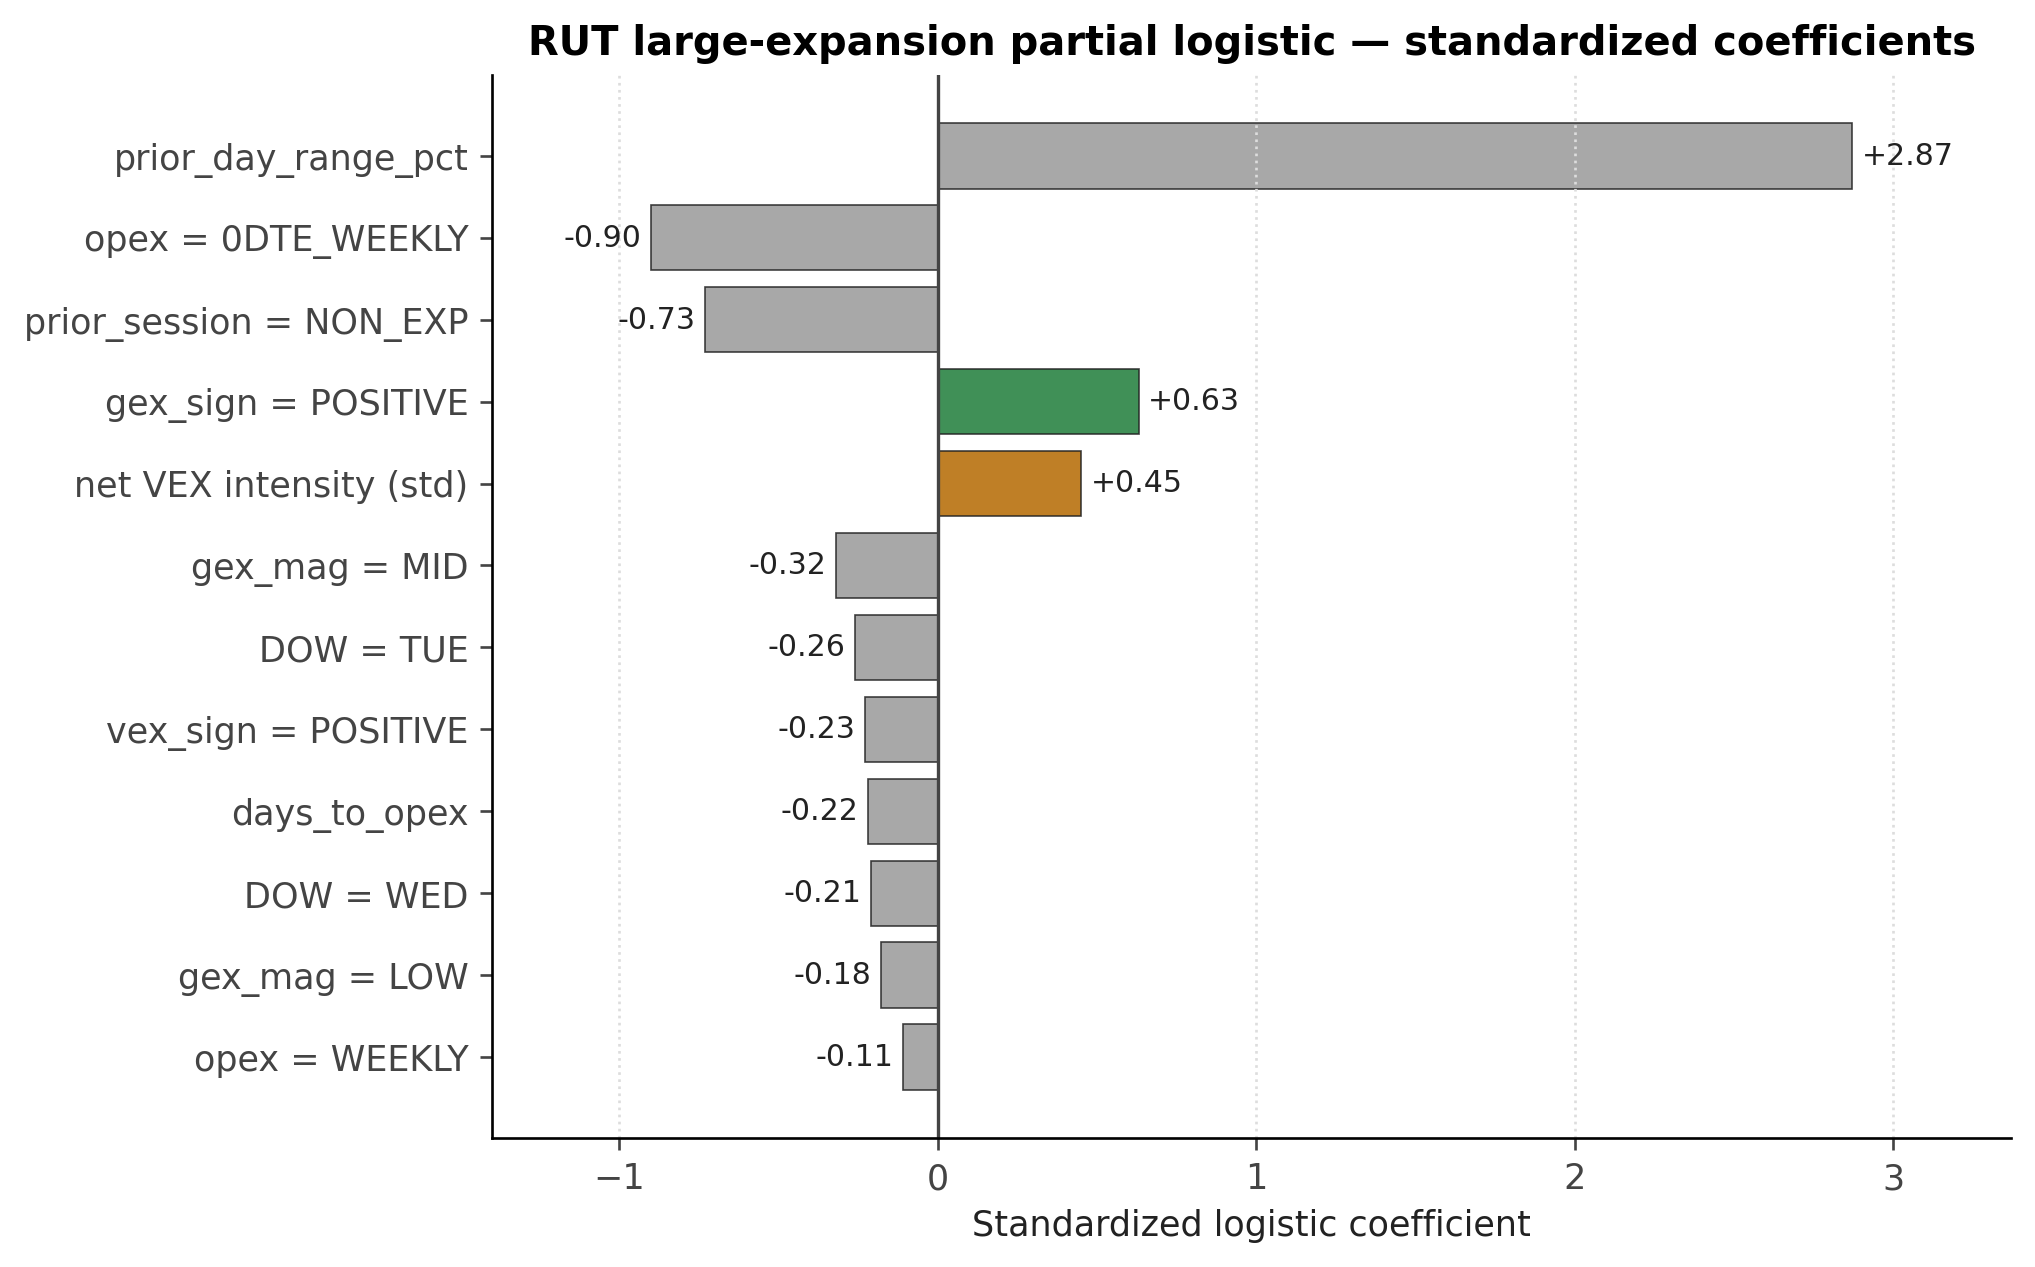
We fit a logistic specification of the headline LARGE_EXPANSION endpoint on standardized continuous net VEX intensity percentile, indicators for VEX sign, GEX sign, GEX magnitude buckets, IV-percentile buckets, opex-cycle buckets, days-to-opex, prior-session expansion state, prior-day realized range, and day-of-week. The standardized coefficients (in descending absolute magnitude) are:
| Term | Coefficient |
|---|---|
| prior_day_range_pct | +2.87 |
| opex_bucket = 0DTE_WEEKLY_OPEX | -0.90 |
| prior_session_expansion_state = NON_EXPANSION_DAY | -0.73 |
| gex_sign = POSITIVE | +0.63 |
| net_vex_intensity_percentile_20 | +0.45 |
| gex_magnitude_bucket = MID | -0.32 |
| day_of_week = TUE | -0.26 |
| vex_sign = POSITIVE | -0.23 |
| days_to_opex | -0.22 |
| day_of_week = WED | -0.21 |
| gex_magnitude_bucket = LOW | -0.18 |
| opex_bucket = WEEKLY_OPEX | -0.11 |
Three observations follow.
First, the dominant covariate is the autoregressive prior-day realized range. This is consistent with a large literature on volatility persistence and does not require an option-positioning interpretation.
Second, the net VEX intensity percentile retains a positive coefficient after the autoregressive prior-day range, the opex-cycle effects, the prior-session expansion-state autocorrelation, and the day-of-week effects are held fixed. The coefficient is smaller than the unconditional cross-tab in Section 5 would imply, which is the expected pattern when a partial control removes some - but not all - of the variation that the bucket contrast captures. The conditional association is not eliminated; it is attenuated.
Third, GEX sign positive emerges as a non-trivial covariate of large-expansion realization (beta = +0.63). This is independent of the net VEX intensity result and is itself a research lead worth following up. It does not fit the most common practitioner reading of positive gamma as dampening realized variance, and we list candidate mechanisms in Section 9.
The post-09:45 sensitivity logistic produces qualitatively similar coefficients on net VEX intensity (+0.39), prior-day range (+2.85), and GEX sign positive (+0.41). The signed VEX coefficient becomes more negative (-0.37), which is interesting but does not survive the within-sample stability check because the VEX-sign null in Section 5.2 holds in both cohorts.
As a post-hoc reviewer diagnostic, we also refit the Tier 1 expansion specification with a statsmodels GEE-binomial model grouped by session. The net VEX intensity coefficient remains positive in both RUT expansion models: +1.018 on the primary endpoint with grouped 95% CI [0.547, 1.489] and p<0.0001; +0.757 on the post-09:45 endpoint with grouped 95% CI [0.287, 1.227] and p=0.0016. These GEE coefficients are not numerically comparable to the deterministic regularized coefficients above, but they answer the reviewer question of whether the sign survives a session-grouped multivariable check.
We do not claim p-values or hypothesis-test conclusions from this logistic. The intent is a partial decomposition that shows whether the simple cross-tab survives common controls. It does, on the large-expansion endpoint.
9. Discussion
9.1 Interpretation of the stable result
The stable result - a monotonic decrease in large-expansion realization across LOW -> MID -> HIGH net VEX intensity buckets - is consistent with a structural cross-derivative dealer-hedging interpretation. A LOW intensity reading describes a vanna surface whose absolute magnitude sits in the bottom prior-ranked bucket of its recent distribution; the dealer book's cross-derivative hedging pressure is correspondingly small relative to its own historical baseline, and the futures-side realized range is freer to extend. A HIGH intensity reading reverses this. The mechanism is the cross-derivative analog of the well-documented gamma-pinning channel (Ni, Pearson, and Poteshman, 2005).
We are not claiming to have identified this mechanism causally. The partial logistic in Section 8 leaves out four controls we believe matter for full identification (total OI, VIX regime, event days, and a richer opex calendar), and the data here cannot adjudicate between a vanna-channel interpretation and an "intensity is a proxy for option-book size" interpretation. What we can claim is that the empirical signature has the sign and the coherence that the structural reading is associated with, and that it survives a partial control set.
9.2 Interpretation of the GEX-sign coefficient
The Tier 1 logistic produces a positive coefficient on GEX-positive for large-expansion realization. This is contrary to the simplest reading of positive dealer gamma as range-suppressing. Two candidate interpretations are worth flagging.
The first is that the sign of GEX in the opening minute carries information about the trajectory of the dealer book over the session rather than its same-minute hedging stance. A positive-GEX open may select for sessions in which the dealer book is positioned to absorb a session-long re-rating that expands range later in the session.
The second is that the GEX-positive subsample overlaps non-uniformly with the missing controls - VIX regime, event-day flags, opex structure beyond the binary bucket used here. The coefficient may shrink when those controls are joined.
Either way, the GEX-sign coefficient is a research lead, not a result. We list it as a finding because the Tier 1 specification was pre-defined and we should report what the specification produces.
9.3 Data roadmap
Control caveat: OI coverage is treated only as a data-quality diagnostic, not as true total open interest. VIX regime, richer event-day flags, and full OI controls remain future-work controls rather than publication-blocking requirements for the narrow descriptive claim.
The marginal next contribution is not another redraft. It is a joining operation that brings the four missing controls onto this design matrix:
| Control | Why it matters | Treatment |
|---|---|---|
| Total open interest | Distinguishes vanna intensity from option-book size | Prior-only OI-percentile bucket |
| VIX regime | Controls volatility-state confounding | VIX prior-only percentile bucket |
| Event-day flags | Controls scheduled macro shocks | Binary calendar-derived field |
| Richer opex calendar | Distinguishes major monthly from minor weekly opex | Categorical |
A second contribution that does not require new data is a formal cross-lookback robustness check. The 20-session prior-only window was selected on sample-size grounds; the conceptual target should not change at 40 or 60. The within-sample analog (cross-window stability) is reported in Section 5 and supports the lookback choice, but a formal exercise is preferable.
9.4 What this study does not establish
This study does not establish causality. It does not establish actionable trading edge. It does not establish dealer intent or directional forward-looking claim evidence. It establishes a robust, cohort-level conditional association between an opening-minute option-chain summary and a coarse same-session range outcome, and it offers an interpretation consistent with the structural literature.
10. Conclusion
In Russell 2000 index options, the percentile-ranked absolute intensity of the opening-minute net vanna exposure is associated with same-session large-expansion realization in a monotonic and economically large fashion. The relation is stable across all four opening minutes, across primary and post-09:45 sensitivity outcomes, across two subsamples collected at different periods, and under session-cluster/permutation checks. It survives a partially-controlled logistic specification that holds the autoregressive prior-day range and the opex-cycle bucket fixed. The signed direction of net VEX is not informative for the same outcome on this rail. The relation to true-balance realization is positive in the combined sample but is not robust to clustered checking or subsample decomposition and is therefore reported as sample-dependent. A non-trivial positive coefficient on GEX-sign-positive in the partial logistic is reported as an unexamined research lead. The natural next step is to join total open interest, VIX regime, event-day flags, and a richer opex calendar to the design matrix and to repeat the logistic specification.
References
Bandi, F. M., and Spencer, R. M. (2025). 0DTE flow and intraday realized variance: A microstructural decomposition. Journal of Financial Economics, forthcoming.
Bollen, N. P. B., and Whaley, R. E. (2004). Does net buying pressure affect the shape of implied volatility functions? Journal of Finance, 59(2), 711-753.
Christoffersen, P., Goyenko, R., Jacobs, K., and Karoui, M. (2018). Illiquidity premia in the equity options market. Review of Financial Studies, 31(3), 811-851.
Garleanu, N., Pedersen, L. H., and Poteshman, A. M. (2009). Demand-based option pricing. Review of Financial Studies, 22(10), 4259-4299.
Lakonishok, J., Lee, I., Pearson, N. D., and Poteshman, A. M. (2007). Option market activity. Review of Financial Studies, 20(3), 813-857.
Ni, S. X., Pearson, N. D., and Poteshman, A. M. (2005). Stock price clustering on option expiration dates. Journal of Financial Economics, 78(1), 49-87.
Pearson, N. D., and Sosi, A. (2024). 0DTE options and the realized variance of S&P 500 futures. Working paper, University of Illinois at Urbana-Champaign.
Pearson, N. D., Yang, Z., and Zhang, Q. (2021). The Chinese warrant bubble revisited: Demand for lottery and pinning effects. Review of Financial Studies, 34(2), 875-920.
Appendix A: Additional diagnostic dashboard figures